|
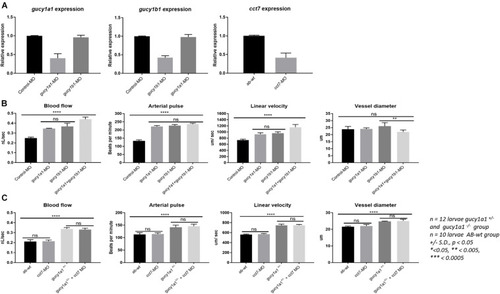
(A) Graphs represent mRNA downregulation of gucy1a1, gucy1b1, and cct7 genes using morpholino (MO) in zebrafish. No cross reactivity of morpholinos was observed between the two subunits of gucy gene in the mRNA expression. (B) Graphs represent comparison of blood flow parameters measured from gucy1a1 (n = 12), gucy1b1 (n = 12), gucy1a1+gucy1b1 (n = 12), and control-MO (n = 10). (C) Graphs presenting comparison of blood flow parameters measured from AB-wild-type (n = 10), cct7-MO (n = 12), gucy1a1+/– (n = 12), and gucy1a1+/– + cct7-MO (n = 12). Data are presented as mean ± standard deviation, significance was set at p < 0.05, and stars denote the significant differences.
|

