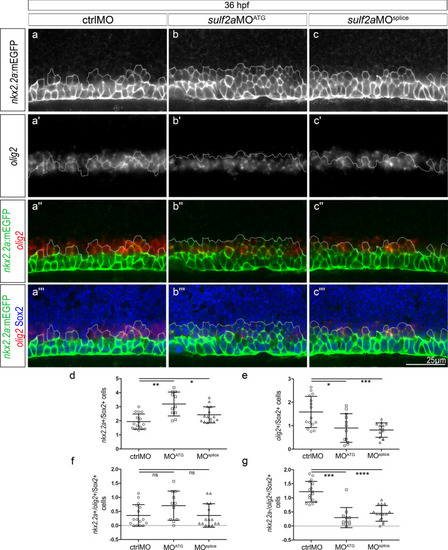
Sulf2a depletion does not affect formation of the Nkx2.2a/Olig2-co-expressing p* domain but reduces the number of progenitors that only express Olig2 at the onset of gliogenesis. Side views of 36 hpf embryos. (a–c”’): Double detection of olig2 mRNA and Sox2 in Tg(nkx2.2a:mEGFP) embryos injected with ctrlMO (a–a”’), sulf2aMOATG (b–b”’) or sulf2aMOsplice (c–c”’). Vertical sets present successively the nkx2.2a:mEGFP signal (green in a”–c”, a”’–c”’), the olig2 mRNA staining (red in a”–c”,a”’–c”’), the merged image of nkx2.2a:mEGFP and olig2 signals and the merged image together with Sox2 staining (blue in a”’–c”’). Dotted line represents the dorsal limit of nkx2.2a:mEGFP-expressing domain. (d-g) Cell quantification performed in embryos injected with ctrlMO (n = 16), sulf2aMOATG (n = 11) and sulf2aMOsplice (n = 15) from three independent experiments. Cell counts in (d,e) correspond to the population of Sox2 + progenitors expressing either nkx2.2a:mEGFP (d) or olig2(e). Quantifications in (f,g) correspond to Sox2 + progenitors that either co-express olig2 and nkx2.2a:mEGFP (f) or express olig2 mRNA but not nkx2.2a:mEGFP (g). Except in e where datasets were compared with Student’s t-test (unpaired two-tailed), datasets were compared with Mann Whitney’s test (two-tailed). Results are presented as a mean number of cells along the dorso-ventral axis per embryo ± s.d (*p < 0,05, ** p < 0,005, ***p < 0.001,****p < 0.0001).
|
