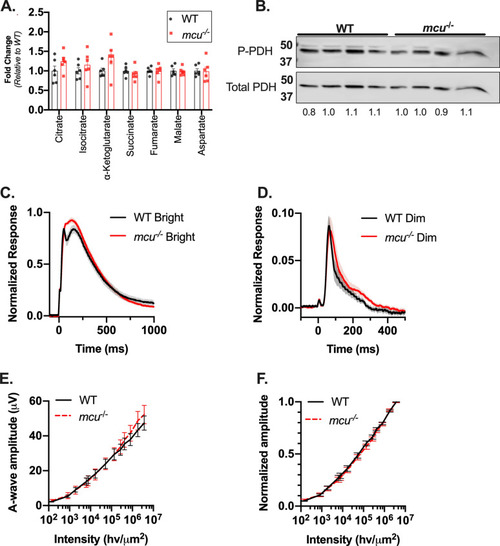
Retinas from global mcu-/- zebrafish have normal morphology, metabolism, and photoresponse. (A) Total TCA cycle metabolite levels in mcu-/- zebrafish retinas relative to WT. Zebrafish were dark-adapted for 18 h and retinas were dissected under red light. α-ketoglutarate levels trend higher in mcu-/- zebrafish retinas, although they are not significantly different than WT (1.4 ± 0.5-fold higher in mcu-/- retinas, p = 0.09 using Welch’s t test, mean ± standard deviation is reported, n = 6 WT and 6 mcu-/- retinas from 3 different fish each). (B) P-Pdh and total Pdh immunoblot from dark-adapted WT and global mcu-/- zebrafish retinas. 15 µg of protein was loaded in each lane. Quantification of the P-Pdh/Pdh ratio of each sample relative to the average WT P-Pdh/Pdh ratio is shown below each lane (n = 4 WT and 4 mcu-/- retinas from 4 different fish each). (C) Ex vivo ERG a-wave responses from WT and mcu-/- zebrafish retinas. Cone responses were isolated using DL-AP4 (40 µM) and CNQX (40 µM) and normalized to Rmax (the maximum response at the brightest light intensity). Bright flash stimulus intensity is 3,650,000 photons µm−2 and 2–23 ms in duration. The mean is reported and the shaded region indicates standard error (n = 21 retinas from 12 WT fish and 21 retinas from 13 global mcu-/- fish). (D) Ex vivo ERG a-wave responses from WT and mcu-/- zebrafish retinas under dim flash stimulus under the same conditions as (C). (E) a-wave response amplitude data plotted as a function of stimulus intensity (photons μm-2) of WT and global mcu-/- retinas from experiments shown in (C) and (D) (Bars indicate standard error). (F) Normalized response amplitude data for experiments shown in (C) and (D) indicate that sensitivity is not changed in global mcu-/- cones (Bars indicate standard error).
|

