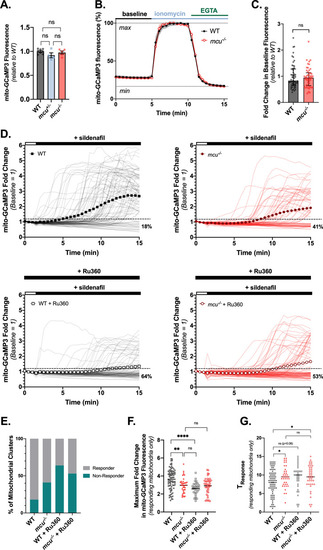
Mitochondrial Ca2+ uptake in cones from global mcu-/- zebrafish is diminished, but not ablated. (A) Total cone mitochondrial fluorescence in gnat2:mito-GCaMP3 larval zebrafish eyes. The mean is reported with bars indicating standard error. (n = 8 WT fish, 4 mcu+/- fish, and 5 mcu-/- fish. ns = not significant using one-way ANOVA with Tukey’s multiple comparisons test). (B) Relative mito-GCaMP3 fluorescence of cone mitochondrial clusters in adult retinal slices of WT or mcu-/- fish expressing gnat2:mito-GCaMP3. Baseline mitochondrial fluorescence was determined in KRB buffer containing 2 mM CaCl2, then ionomycin (5 µM) was added to allow 2 mM Ca2+ entry into the mitochondria to saturate the probe. Next, EGTA (5 mM) was added to the solution (holding 5 µM ionomycin constant) to chelate Ca2+ and determine minimum mito-GCaMP3 fluorescence. The mean is reported and shaded region = 95% CI. (n = 55 mitochondrial clusters (three fish) for WT and n = 51 mitochondrial clusters (three fish) for mcu-/-). (C) Fold change in baseline mito-GCaMP3 fluorescence relative to WT average. The median is reported with bars indicating interquartile range. (ns = not significant using Mann–Whitney test). (D) gnat2:mito-GCaMP3 retina slices preincubated with 100 µM KB-R7943 (10 min prior to imaging and white bar) then subjected to 25 µM sildenafil (black bar). For Ru360 treatment, retinal slices were preincubated for 1 h in 10 µM Ru360 and then the same experiment was performed in the presence of 10 µM Ru360. The mean response of all mitochondrial clusters is reported with the dark trace, while the semi-transparent traces show the responses of each individual mitochondrial cluster. The dotted line indicates 1.2-fold above baseline. (Mitochondrial clusters from n = 86 WT, n = 64 mcu-/-, n = 86 WT + Ru360, and n = 85 mcu-/- + Ru360 cells are reported. All conditions were tested in multiple slices from n = 3 fish each). (E) The percent of mitochondrial clusters from each condition which responded or did not respond to sildenafil. Mitochondrial clusters which exhibited an increase in mito-GCaMP3 fluorescence of 1.2-fold or greater above baseline at any time after sildenafil treatment are considered to have responded. (n = 86 WT, n = 64 mcu-/-, n = 86 WT + Ru360, and n = 85 mcu-/- + Ru360). (F) The maximum fold change in mito-GCaMP3 fluorescence at any time during imaging. Mitochondrial clusters which did not respond to sildenafil are excluded. (n = 80 WT, n = 38 mcu-/-, n = 31 WT + Ru360, n = 40 mcu-/- + Ru360). (G) The time at which each mitochondrial cluster first increased mito-GCaMP3 fluorescence 1.2-fold above baseline. (n = 80 WT, n = 38 mcu-/-, n = 31 WT + Ru360, n = 40 mcu-/- + Ru360).
|

