
Fig. 3
- ID
- ZDB-FIG-180103-3
- Publication
- Nagasawa-Masuda et al., 2017 - Yap/Taz transcriptional activity is essential for vascular regression via Ctgf expression and actin polymerization
- Other Figures
- All Figure Page
- Back to All Figure Page
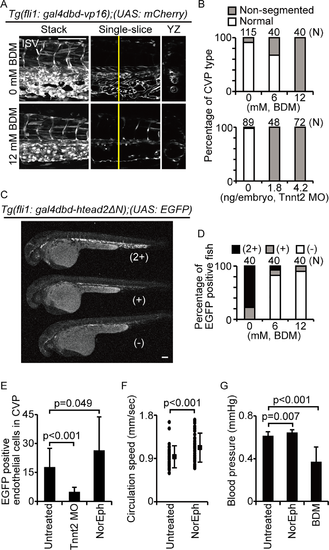
Yap/Taz is activated by blood flow in the CVP. (A and B) Images of mCherry intensity in indicated embryos at 36 hpf are shown. Embryos were treated with or without 12 mM BDM from 28–36 hpf and quantified. Scale bars: 100 μm Similar experiments were performed with morpholino for Tnnt2. (C and D) Representative images of EGFP signal levels in indicated embryos at 36 hpf are shown. Signal intensity was qualitatively categorized as low (−), intermediate (+), or high (2+), as shown. Scale bar: 100 μm. (E) The number of EGFP-positive cells in Tg(fli1: gal4dbd-htead2ΔN);(UAS: EGFP) embryo in CVP at 32 hpf are shown. Untreated embryos are shown as control (n = 14). Some embryos were treated with Tnnt2 MO (n = 18). Some embryos were treated with 1mM norepinephrine (NorEph) (n = 17). (F) Circulation speed of blood cells in fish treated with 1mM norepinephrine were measured as described materials and methods section. Each dot indicates the circulation speed of blood cells in one control embryo (n = 7) or norepinephrine-treated embryo (n = 10). Solid squares and error bars represent means and SDs. (G) Blood pressure in fish treated with 1mM norepinephrine or 12 mM BDM were measured. Data are means and SDs for the control (n = 24), norepinephrine treatment (n = 18), and BDM treatment (n = 7). |