
Fig. S3
- ID
- ZDB-FIG-170104-17
- Publication
- Jiménez-Amilburu et al., 2016 - In Vivo Visualization of Cardiomyocyte Apicobasal Polarity Reveals Epithelial to Mesenchymal-like Transition during Cardiac Trabeculation
- Other Figures
- All Figure Page
- Back to All Figure Page
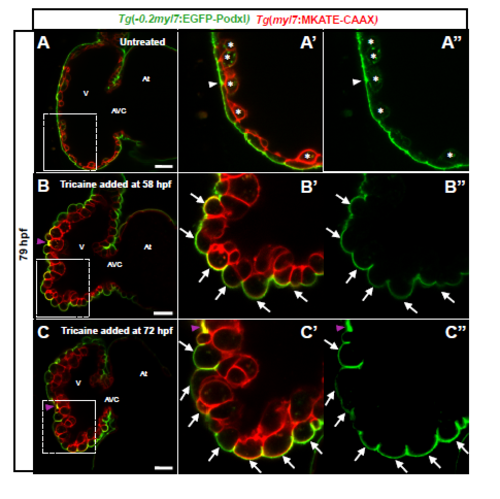
Apical constriction and cardiomyocyte depolarization are blood flow/cardiac contractility dependent (A-C'') Confocal images (mid-sagittal sections) of 79 hpf Tg(-0.2myl7:EGFPpodxl); Tg(myl7:MKATE-CAAX) zebrafish hearts. Tricaine was added at 58 (B-B'') or 72 (CC'') hpf. Boxed area in A shown in A' and A''. Untreated larvae at 79 hpf showing depolarized cardiomyocytes (A' and A'', asterisks) and apical constriction (A' and A'', arrowhead). Boxed area in B and C shown in B', B'' and C' and C'', respectively. At 79 hpf, larvae treated since 58 hpf did not exhibit any apical constriction or depolarized cardiomyocyte (B' and B'', arrows). At 79 hpf, larvae treated with tricaine since 72 hpf did not exhibit any apical constriction or depolarized cardiomyocyte (C' and C'', arrowheads). Purple arrowheads in B and C-C'' point to apical podocalyxin accumulation due to the heart collapse after tricaine exposure. At, atrium; V, ventricle; AVC, atrioventricular canal. Scale bars, 20 μm. |