Fig. 3
- ID
- ZDB-FIG-170104-10
- Publication
- Jiménez-Amilburu et al., 2016 - In Vivo Visualization of Cardiomyocyte Apicobasal Polarity Reveals Epithelial to Mesenchymal-like Transition during Cardiac Trabeculation
- Other Figures
- All Figure Page
- Back to All Figure Page
|
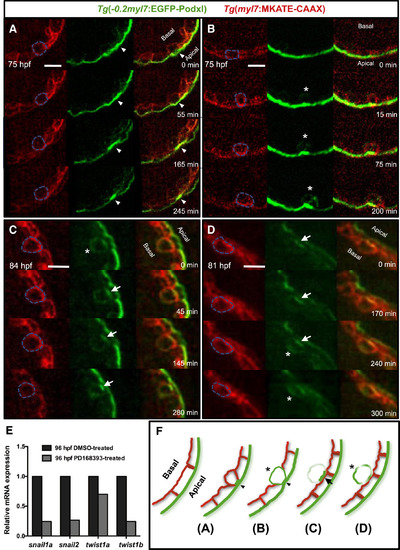
Live Imaging at Single-Cell Resolution of CM Polarization during Cardiac Trabeculation (A–D) Time-lapse movies of Tg(−0.2myl7:EGFP-podxl);Tg(myl7:MKATE-CAAX) beating zebrafish hearts between 75 and 90 hpf. (A) Apical constriction of a compact-layer CM; arrowheads point to the progressive condensation of EGFP-Podxl expression over time. Single-plane images taken from Movie S1. (B) CM depolarization prior to delamination; asterisks indicate the depolarized CM. Single-plane images taken from Movie S2. (C) Re-polarization is sometimes observed once CMs delaminate and enter the trabecular layer; asterisks indicate depolarized CM, and arrows point to subsequent EGFP-Podxl enrichment on one side of the CM. Single-plane images taken from Movie S3. (D) Second depolarization event in the trabecular layer; arrows point to EGFP-Podxl enrichment, and asterisks indicate the new depolarization event. Single-plane images taken from Movie S4. (E) qPCR analysis of snail1a, snail2, twist1a, and twist1b expression in 96-hpf zebrafish hearts from DMSO- and PD168393-treated larvae (treated from 55 to 96 hpf). (F) Cartoons illustrating the changes in CM polarization during trabeculation. Blue dashed lines outline the delaminating CMs examined (A–D). Scale bars, 10 μm. |
| Genes: | |
|---|---|
| Fish: | |
| Condition: | |
| Anatomical Terms: | |
| Stage Range: | Protruding-mouth to Day 4 |
| Fish: | |
|---|---|
| Condition: | |
| Observed In: | |
| Stage: | Day 4 |

