
Fig. 6
- ID
- ZDB-FIG-161201-26
- Publication
- Monroe et al., 2016 - Hearing sensitivity differs between zebrafish lines used in auditory research
- Other Figures
- All Figure Page
- Back to All Figure Page
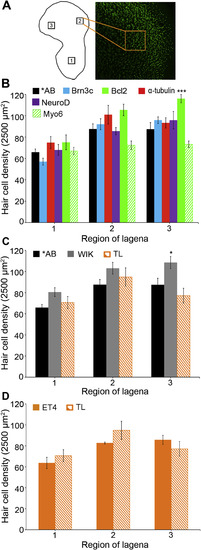
Hair bundle density in the lagena. (A) Lagena schematic showing the three sampling locations, with an example of location 2 shown in the confocal image. All boxes are 50 × 50 μm and are drawn to scale. (B) For *AB and transgenic lines created on the *AB background, bundle density is significantly different between genotypes and sampling regions (2-way ANOVA, F5,160 = 8.91, p < 0.001; and F2,160 = 43.02, p < 0.001, respectively). In sampling region 3, bundle density is significantly higher in Bcl2 fish than in *AB fish (Bonferroni-corrected posthoc, ***p < 0.001). (C) There is a significant difference in lagenar bundle density between wildtype lines (2-way ANOVA, F2,68 = 9.08, p < 0.001 for genotype main effect), with WIK fish having higher density in region 3 than AB fish (*p < 0.05). (D) There is no difference in bundle density between ET4 and TL fish (2-way ANOVA, F1,24 = 0.40, p = 0.53 for genotype main effect). Data are presented as mean ± S.E. N = 8–17 fish per genotype. |
| Fish: | |
|---|---|
| Observed In: | |
| Stage: | Adult |
Reprinted from Hearing Research, 341, Monroe, J.D., Manning, D.P., Uribe, P.M., Bhandiwad, A., Sisneros, J.A., Smith, M.E., Coffin, A.B., Hearing sensitivity differs between zebrafish lines used in auditory research, 220-231, Copyright (2016) with permission from Elsevier. Full text @ Hear. Res.