- Title
-
Hearing sensitivity differs between zebrafish lines used in auditory research
- Authors
- Monroe, J.D., Manning, D.P., Uribe, P.M., Bhandiwad, A., Sisneros, J.A., Smith, M.E., Coffin, A.B.
- Source
- Full text @ Hear. Res.
|
Transgene expression profiles for zebrafish lines used in this study. (A) Brightfield image of 5 dpf *AB zebrafish head. The otoliths of the inner ear are clearly visible. (B) *AB larva stained with the vital dye DASPEI, showing the location of lateral line neuromasts (yellow dots). (C) Lateral view of a Brn3c:mGFP fish shows GFP expression in lateral line neuromasts, inner ear epithelia, and retinal tectum. (D) GFP expression in the myo6:EGFP-Bcl2 larva is localized to lateral line neuromasts and inner ear epithelia. Note that the heart also expresses GFP as a transgenesis marker, but the heart GFP is not fused to Bcl2. (E) Myo6:EGFP larvae express bright cytoplasmic GFP in lateral line and inner ear hair cells. (F) ET4 larvae express GFP in all hair cells. (G) The α-tubulin:tdTomato larva expresses the red fluorescent protein tdTomato in all hair cells, and shows diffuse expression in multiple brain regions. (H) Lateral view of NeuroD:tagRFP transgenic fish shows RFP expressed in multiple brain regions as well as the pancreas, but not in the inner ear or lateral line. Scale bar in A equals 250 μm and applies to all larval head images (A–H). (I) Lateral view of Brn3c:mGFP adult with neuromasts visible as rows of fluorescent dots around the eye and on the gill cover. The brain and inner ear fluorescence is obscured by skin pigmentation. The scale bar in G is 1 mm. (For interpretation of the references to colour in this figure legend, the reader is referred to the web version of this article.) |

ZFIN is incorporating published figure images and captions as part of an ongoing project. Figures from some publications have not yet been curated, or are not available for display because of copyright restrictions. PHENOTYPE:
|

ZFIN is incorporating published figure images and captions as part of an ongoing project. Figures from some publications have not yet been curated, or are not available for display because of copyright restrictions. |
|
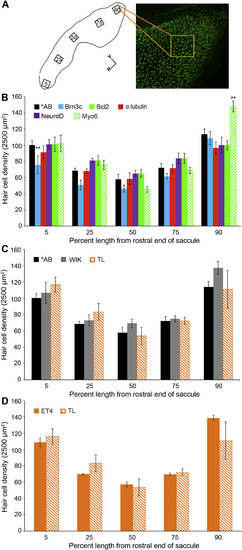
Hair bundle density in the zebrafish saccule. (A) Schematic of the saccular epithelium showing the location of our five sampling regions along the rostral-caudal axis. The confocal image on the right is an example of a phalloidin-labeled saccule. All boxes are 50 × 50 μm and are drawn to scale. V = ventral, R = rostral. (B) Comparison of bundle density in *AB fish and transgenic lines on a *AB background. Hair bundle density significantly differs by genotype and saccular location (2-way ANOVA, F5,225 = 6.88, p < 0.001; and F4,225 = 79.06, p < 0.001, respectively). Bonferroni-corrected posthoc tests were then used to compare each transgenic line to the *AB wildtype fish, where **p < 0.01 indicates significant differences from *AB at that saccular location. (C) There is no significant difference in saccular hair bundle density between wildtype strains (2-way ANOVA, F2,96 = 2.65, p = 0.07). (D) Saccular bundle density does not differ between transgenic ET4 fish and wildtype TL fish (2-way ANOVA, F1,31 = 0.08, p = 0.78). Data are presented as mean ± S.E. N = 4–12 fish per group. |
|
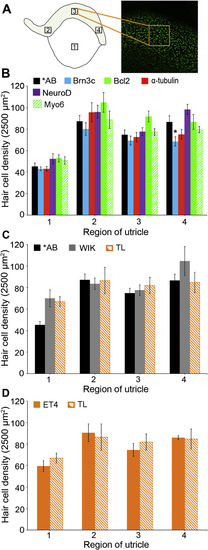
Hair bundle density in the utricle. (A) Schematic of the utricle showing one sampling location in the extrastriolar region (box 1) and three locations in the striolar region (boxes 2–4, striolar region in light yellow). The phalloidin-labeled confocal image on the right depicts a striolar location. All boxes are 50 × 50 μm and are drawn to scale. (B) For lines made on a *AB background, bundle density is significantly different between genotypes and utricular locations (2-way ANOVA, F5,189 = 8.36, p < 0.001; and F3,189 = 89.39, p < 0.001, respectively). Posthoc comparisons of transgenic lines to *AB wildtype fish show a significant difference between *AB and Brn3c fish at utricular position 4 (*p < 0.05). (C) There is no significant difference in utricular hair bundle density between background strains (2-way ANOVA, F2,59 = 2.64, p = 0.08 for background as a main effect). (D) Utricular hair bundle density does not differ between ET4 fish and the TL background strain on which they were created (2-way ANOVA, F1,24 = 0.21, p = 0.65). Data are presented as mean ± S.E. N = 4–15 fish per group. (For interpretation of the references to colour in this figure legend, the reader is referred to the web version of this article.) PHENOTYPE:
|
|
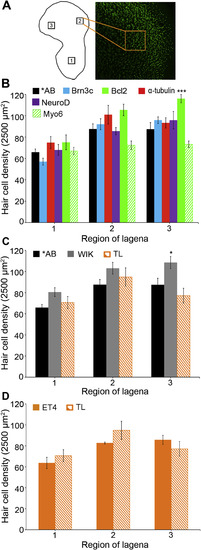
Hair bundle density in the lagena. (A) Lagena schematic showing the three sampling locations, with an example of location 2 shown in the confocal image. All boxes are 50 × 50 μm and are drawn to scale. (B) For *AB and transgenic lines created on the *AB background, bundle density is significantly different between genotypes and sampling regions (2-way ANOVA, F5,160 = 8.91, p < 0.001; and F2,160 = 43.02, p < 0.001, respectively). In sampling region 3, bundle density is significantly higher in Bcl2 fish than in *AB fish (Bonferroni-corrected posthoc, ***p < 0.001). (C) There is a significant difference in lagenar bundle density between wildtype lines (2-way ANOVA, F2,68 = 9.08, p < 0.001 for genotype main effect), with WIK fish having higher density in region 3 than AB fish (*p < 0.05). (D) There is no difference in bundle density between ET4 and TL fish (2-way ANOVA, F1,24 = 0.40, p = 0.53 for genotype main effect). Data are presented as mean ± S.E. N = 8–17 fish per genotype. PHENOTYPE:
|
|
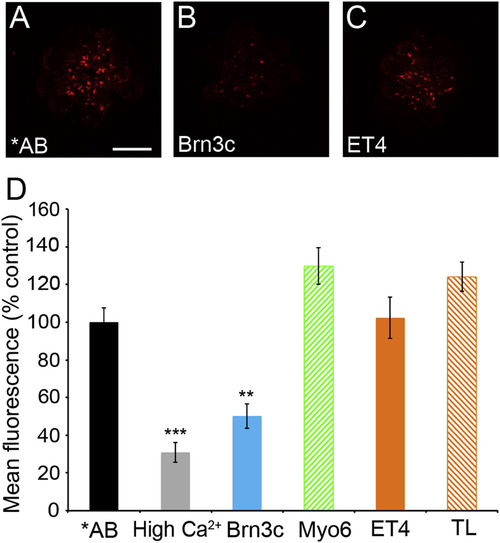
Transgene expression affects mechanotransduction in Brn3c larvae. We used uptake of FM1-43 by hair cells as a proxy for transduction channel function. (A–C) Confocal images of FM1-43 labeling of the MI1 neuromast in (A) *AB fish, (B) Brn3c fish, and (C) ET4 fish. The scale bar in A = 10 μm and applies to all panels. (D) Quantification of mean fluorescence (arbitrary units) in the MI1 neuromast shows a significant effect of genotype/treatment (1-way ANOVA, F5 = 24.72, p < 0.001), due to a significant reduction in FM fluorescence in the high calcium (**p < 0.001) and Brn3c (**p < 0.01) groups (Tukey's multiple comparison test). Data are presented as mean ± S.E., and mean fluorescence is normalized to fluorescence in *AB controls from the same experiment. High extracellular calcium, which reduces the open probability of the transduction channel, was used as a control. N = 10–11 fish per treatment. |
Reprinted from Hearing Research, 341, Monroe, J.D., Manning, D.P., Uribe, P.M., Bhandiwad, A., Sisneros, J.A., Smith, M.E., Coffin, A.B., Hearing sensitivity differs between zebrafish lines used in auditory research, 220-231, Copyright (2016) with permission from Elsevier. Full text @ Hear. Res.


