
FIGURE
Fig. 1
- ID
- ZDB-FIG-160125-1
- Publication
- Donizetti et al., 2015 - Expression pattern of zebrafish rxfp2 homologue genes during embryonic development
- Other Figures
- All Figure Page
- Back to All Figure Page
Fig. 1
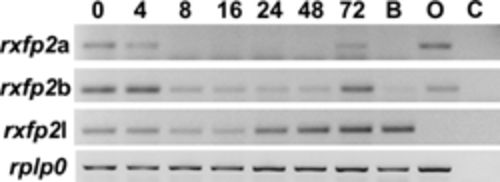
Embryonic gene expression pattern for the three rxfp2 genes by RT-PCR analysis. The different embryonic stages are indicated on top as hours post fertilization. Amplification of rplp0 cDNA was used as a control of RT-PCR sensitivity in the assay. B and O indicate cDNA obtained by retrotranscription of RNA extracted from adult zebrafish brain and ovary respectively. C indicates the negative PCR control reaction lacking cDNA template. |
Expression Data
| Genes: | |
|---|---|
| Fish: | |
| Anatomical Terms: | |
| Stage Range: | 1-cell to Adult |
Expression Detail
Antibody Labeling
Phenotype Data
Phenotype Detail
Acknowledgments
This image is the copyrighted work of the attributed author or publisher, and
ZFIN has permission only to display this image to its users.
Additional permissions should be obtained from the applicable author or publisher of the image.
Full text @ J. Exp. Zool. B Mol. Dev. Evol.