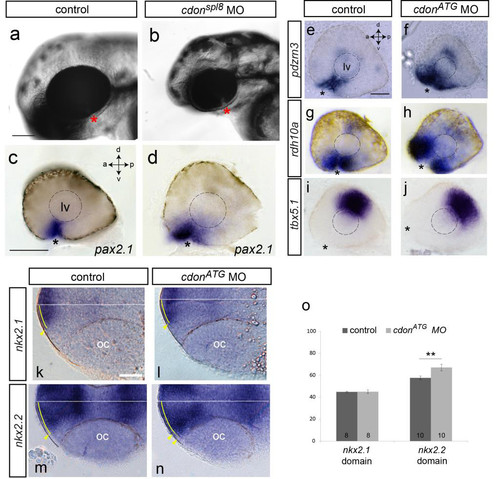
cdonspl8 splicing MO reproduces the phenotype observed in cdonATG morphants, which display an expansion of ventral markers. Bright field, lateral images of 48 hpf control (a) and cdonspl8 morphant characterized by the presence of coloboma (b). Lateral views of the eyes of control and cdonspl8 morphants hybridized in toto with probes for pax2.1 (c, d) (17/40 embryos). Note that in cdonspl8 morphants pax2.1 expression is expanded in comparison to controls (c, d). Lateral views of the eyes of control and cdonATG morphants hybridized in toto with probes for the ventral retinal markers pdzrn3 (e, f) and rdh10a (g, h) or the dorsal retinal marker tbx5.1 (i, j). In cdonATG morphants the ventral retina markers pdzrn3 (28/54 embryos) and rdh10a (32/44 embryos) are also expanded in comparison to controls (e-h) whereas tbx5.1 (62/62 embryos) shows no evident changes in comparison to controls (i, j). The dashed lines mark the lens, and the asterisks indicate the position of the optic fissure. (k-n) Horizontal cryostat sections of control and cdonATG morphant embryos hybridized with probes for nkx2.1 and nkx2.2 at 26hpf. The dotted black lines indicate the distance from the midline to the optic cup. The yellow lines depict the extent of gene expression in the medio-lateral direction and the yellow arrowheads indicate the most distal/lateral position of the positive signal. The dotted yellow line in n depicts the expansion of nkx2.2 expression observed in cdonATG embryos. o) Quantitative analysis of the nkx2.1 and nkx2.2 anterior expression domains. Note that nkx2.2 expression in morphants is significantly different from that of controls (**p< 0.01; Student’s t-test). The number of embryos analysed in each case is as follow: nkx2.1, n=8 for both control and MO injected embryos; nkx2.2, n=10 for both control and MO injected embryos). This information is also indicated in each column Error bars in o represent s.e.m. a, anterior; d, dorsal; lv, lens vesicle; oc, optic cup; p, posterior; v, ventral. Scale bars: 100 μm.
|

