Fig. 3
- ID
- ZDB-FIG-131024-18
- Publication
- Akitake et al., 2011 - Transgenerational analysis of transcriptional silencing in zebrafish
- Other Figures
- All Figure Page
- Back to All Figure Page
|
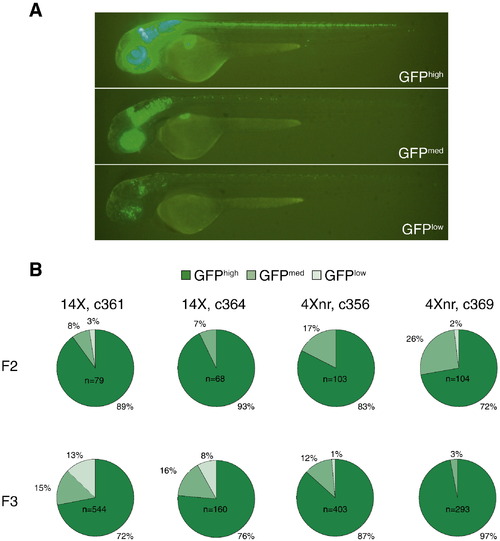
Transgenerational analysis of UAS-regulated GFP expression. (A) Scoring of representative c364 transgenic larvae carrying the ptf1a driver and 14X UAS:GFP reporter transgenes as GFPhigh, GFPmed, or GFPlow, based on the extent of GFP labeling within the ptf1a expression domain. (B) Transgenerational analysis of GFP fluorescence in independently derived lines. All F2 larvae were obtained from matings between single F1 adults and AB fish. After F2 larvae were evaluated for their GFP labeling, GFPmed and GFPhigh individuals were raised, mated to AB, and their progeny scored in the F3 generation. Only GFP-positive F3 larvae were included in the pie charts, which represent the cumulative data from at least five different GFPmed and GFPhigh F2 parents for each line. |
Reprinted from Developmental Biology, 352(2), Akitake, C.M., Macurak, M., Halpern, M.E., and Goll, M.G., Transgenerational analysis of transcriptional silencing in zebrafish, 191-201, Copyright (2011) with permission from Elsevier. Full text @ Dev. Biol.

