
FIGURE
Fig. 3
Fig. 3
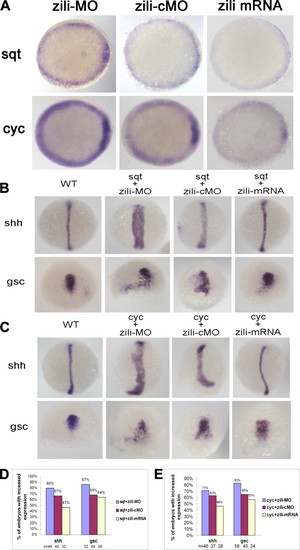
Genetic interactions between zili and nodal signals. A, sqt and cyc expression in embryos injected with zili-MO or zili-cMO or zili mRNA. Embryos at the 50% epiboly stage are shown in animal pole views with the dorsal oriented toward the right. B and C, expression of the marker genes (indicated on the left). Dorsal views with the animal pole oriented toward the top for shh and gsc at bud and at the 60% epiboly stage are shown. D and E, statistical data for B and C, respectively. WT, wild type. |
Expression Data
| Genes: | |
|---|---|
| Fish: | |
| Knockdown Reagent: | |
| Anatomical Terms: | |
| Stage: | 50%-epiboly |
Expression Detail
Antibody Labeling
Phenotype Data
Phenotype Detail
Acknowledgments
This image is the copyrighted work of the attributed author or publisher, and
ZFIN has permission only to display this image to its users.
Additional permissions should be obtained from the applicable author or publisher of the image.
Open Access.
Full text @ J. Biol. Chem.