Fig. 4
- ID
- ZDB-FIG-090220-59
- Publication
- Devine et al., 2009 - A dynamic Gli code interprets Hh signals to regulate induction, patterning, and endocrine cell specification in the zebrafish pituitary
- Other Figures
- All Figure Page
- Back to All Figure Page
|
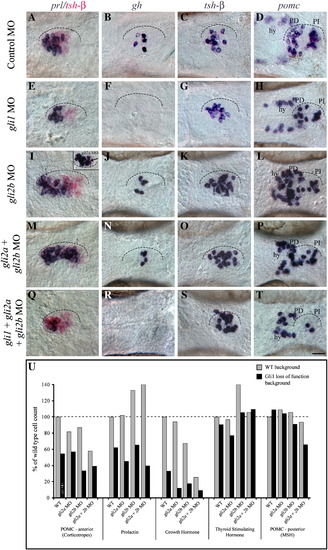
Gli function in endocrine cell determination. (A–D) Normal expression of prl, gh, tsh-β and pomc in the adenohypophysis at 48 hpf (ventral view, anterior left). The adenohypophysis is outlined. (E–H) Loss of Gli1 function either by gli1 MO injection or in dtr(gli1-/-) mutants (not shown) reduced prl (E) and anterior pomc (H) expressing cells and eliminated gh (F) expressing cells. tsh-β (G) and posterior pomc cells (H) were relatively unaffected by loss of Gli1 function. (I–L) In contrast, loss of Gli2b function expanded prl (I) and tsh-β (K) populations, slightly reduced anterior pomc (L) and gh (J) expressing cells, and had little effect on posterior pomc cells (L). Hypothalamic (hy) pomc populations appeared to expand in response to reduced Gli2b function (L). Injection of gli2a MOs also expanded prl cells posteriorly (I, inset) in 40% of embryos examined. (M–P) Simultaneous loss of Gli2a and Gli2b function further expanded prl populations (M), reduced anterior pomc cells (P) and had little effect on gh (N), tsh-β (O) and posterior pomc (P) expressing cells. (Q–T) Loss of Gli1 in combination with loss of Gli2a and Gli2b eliminated the expansion of prl cells seen following Gli2b MO injection (Q), further reduced gh (R) and anterior pomc cells (T), and slightly expanded tsh-β cell numbers (S). (U) Graph showing cell numbers across all Gli loss-of-function experiments, represented as percentage of wild type cell numbers. Gray shading shows the results following injection of gli2 (2a and/or 2b) MOs in a wild type background. Black shading shows the results obtained following injection of gli2 (2a and/or 2b) MOs in a gli1 loss-of-function background. Scale bar: A–T; 25 μm. |
| Genes: | |
|---|---|
| Fish: | |
| Knockdown Reagents: | |
| Anatomical Terms: | |
| Stage: | Long-pec |
Reprinted from Developmental Biology, 326(1), Devine, C.A., Sbrogna, J.L., Guner, B., Osgood, M., Shen, M.C., and Karlstrom, R.O., A dynamic Gli code interprets Hh signals to regulate induction, patterning, and endocrine cell specification in the zebrafish pituitary, 143-154, Copyright (2009) with permission from Elsevier. Full text @ Dev. Biol.

