
FIGURE
Fig. 9
Fig. 9
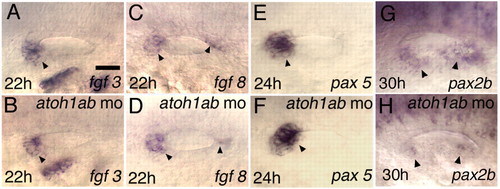
Expression of macular genes. Expression of fgf3 (A,B) and fgf8 at 22 hpf (C,D), pax5 at 24 hpf (E,F) and pax2b at 30 hpf (G,H) in control embryos (A,C,E,G) and atoh1a;atoh1b double morphants (B,D,F,H). All panels show dorsolateral views with anterior to the left and dorsal up. Arrowheads indicate expression in sensory epithelia. Scale bar, 30 μm. |
Expression Data
| Genes: | |
|---|---|
| Fish: | |
| Knockdown Reagents: | |
| Anatomical Term: | |
| Stage Range: | 26+ somites to Prim-15 |
Expression Detail
Antibody Labeling
Phenotype Data
Phenotype Detail
Acknowledgments
This image is the copyrighted work of the attributed author or publisher, and
ZFIN has permission only to display this image to its users.
Additional permissions should be obtained from the applicable author or publisher of the image.
Full text @ Development