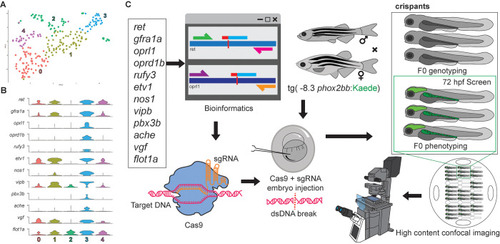
construction of an F0 CRISPR screen for ENS development.

(A) tSNE plot shows five distinct sub-clusters after the subset analysis and re-clustering of Clusters 5 and 12 from the [20] 68–70 hpf data set. (B) Violin plots reveal high single-cell expression distribution in sub-cluster 3 of ENS candidate genes. (C) Twelve genes underwent a comprehensive CRISPR screen, involving bioinformatic design, and CRISPR-Cas9 mutagenesis in -8.3phox2bb:Kaede zebrafish larvae to visualize enteric cells. The screening strategy included subsequent genotyping validation and high-content phenotyping.

Candidate genes targeted in an F0 CRISPR screen display ENS phenotypic alterations.

(A) At 48 hpf, eight crispant embryos from pools of around thirty embryos were used to validate CRISPR activity via T7E1, for each gene targeted. If the majority had indels, then subsets of the pool were grown at 3 to 4 dpf to phenotype their ENS. The phenotyping process combined crispants of different genes by using an agarose cast that enabled high-content semi-automated confocal imaging. An additional fraction of the crispants were analyzed at 4–6 dpf for additional HCR validation or for late phenotypic alterations. (B) Representative images of different T7E1 assays demonstrate indels of different embryos in the specific gene-targeted regions. etv1 gene was genotyped using ZEG. The asterisks denote the presence of cleaved products. (C) Percentage of embryos with CRISPR/Cas9 induced indels of different ENS genes (≥ 2 experiments). (D) Confocal images of Tg(-8.3phox2bb:Kaede) ENCCs/ENs for different crispants along the gut at 72 hpf. ENCCs/ENs of most crispants failed to localize distal hindgut (≥ 2 experiments). (E) Pools of the twelve ENS gene crispants showing the percentage of phenotypic alterations (≥ 3 experiments). (F) Number of fluorescent ENCCs and/or ENs along the gut from the different gene crispants (≥ 3 experiments with 3 biological replicates). Comparing the mean of the control with the mean of each gene, ANOVA P value ****: <0.0001, ***: 0.0004, **: <0.003, *: <0.05.

Expression pattern of CRISPR screen selected genes along the ENS during development.

(A, C, E, G) Confocal images show HCR-assayed expression for ret, etv1, oprl1 and oprd1b through the gut of Tg(-8.3phox2bb:Kaede) larvae at 96 hpf, dashed yellow lines surround the gut. (B-B”, D-D”, F-F”, H-H”) Magnified regions of the foregut showing colocalization of ret, etv1, oprl1 and oprd1b (magenta) with ENCCs expressing the Kaede protein (green). ≥ 3 experiments with 3 biological replicates.

Temporal chemical inhibition of opioid receptors induces ENS developmental defects in zebrafish larvae.

(A) Tg(-8.3phox2bb:Kaede) embryos were exposed at 48 hpf for 48 hpe (hours post exposure) with the opioid inhibitors, LY2940094, curcumin and DADLE, all of them at 10 μM. (B-E) Confocal images reveal fluorescent labeled ENCCs/ENs along the gut in larvae that were treated with DMSO, LY2940094, curcumin and DADLE, respectively. Inhibitor-treated larvae show a reduction of Kaede+ cells, compared with the DMSO control (F) Cell counts of Kaede cells via Imaris, ≥ 3 experiments with 3 biological replicates, mean +/- SEM, ANOVA P value ****: < 0.0001, ***: < 0.0004. Dashed purple lines surround the gut. Number of fluorescent ENCCs and/or ENs along the gut from the different gene crispants.

ENS neurochemical coding is altered in larval crispants for opioid receptor-encoding genes oprd1b and oprl1.

(A, C, E) Confocal images show whole ENS after immunohistochemistry in 6 dpf control, and oprd1b and oprl1 crispants, respectively. The targeted proteins were Phox2b (yellow), HuC/D (magenta), 5-HT (cyan) and Chat (green). Dashed red lines surround the gut. (B-B””, D-D””, F-F””) depict individual channels and magnification of the ENS midgut region to show the different marker proteins dissected by colors. In parenthesis next to each marker: Cell counts using Imaris software, n = 3 biological replicates.

Acknowledgments
This image is the copyrighted work of the attributed author or publisher, and ZFIN has permission only to display this image to its users. Additional permissions should be obtained from the applicable author or publisher of the image. Full text @ PLoS One