IMAGE

Fig 1

ID
ZDB-IMAGE-240531-126
Source
Figures for Moreno-Campos et al., 2024
Image
Figure Caption

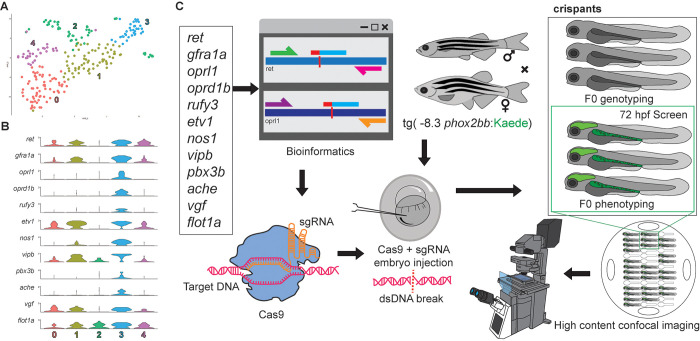
Fig 1 construction of an F0 CRISPR screen for ENS development.

(A) tSNE plot shows five distinct sub-clusters after the subset analysis and re-clustering of Clusters 5 and 12 from the [20] 68–70 hpf data set. (B) Violin plots reveal high single-cell expression distribution in sub-cluster 3 of ENS candidate genes. (C) Twelve genes underwent a comprehensive CRISPR screen, involving bioinformatic design, and CRISPR-Cas9 mutagenesis in -8.3phox2bb:Kaede zebrafish larvae to visualize enteric cells. The screening strategy included subsequent genotyping validation and high-content phenotyping.

Acknowledgments
This image is the copyrighted work of the attributed author or publisher, and ZFIN has permission only to display this image to its users. Additional permissions should be obtained from the applicable author or publisher of the image. Full text @ PLoS One