
- Title
-
gys1 regulates maternal glycogen reserve essential for embryonic development in zebrafish
- Authors
- Chen, J., Ji, X., Gao, J., Huang, J., Ren, J.
- Source
- Full text @ Heliyon

Maternal gys1 mutant embryos exhibit morphological defect and high mortality rate. (a) Bright-field images showing delayed embryonic development of maternal gys1 mutant embryos from gys1−/− ♀ cross with gys1+/+ ♂, in contrast to time-matched parental gys1 mutant embryos from gys1−/− ♂ cross with gys1+/+♀ from 2 hpf to 48 hpf. Small head phenotype was indicated in rectangles, brain necrosis was indicated with red arrows, small eye phenotype was indicated with asterisks, reduced pigmentation phenotype was indicated with black arrows. (b) Survival Rate of embryos from gys1−/− ♀ cross with gys1+/+ ♂ (n = 1175) and gys1−/− ♂ cross with gys1+/+♀ (n = 885) from 0 hpf to 48 hpf, survival rate was plotted by Kaplan-Meier method, Log-rank (Mantel-Cox) test showed p < 0.0001. (For interpretation of the references to colour in this figure legend, the reader is referred to the Web version of this article.) |
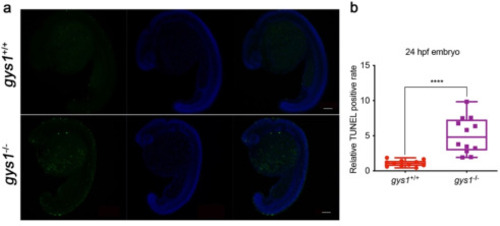
Loss of maternal gys1 promotes cell apoptosis in embryos. (a)TUNEL (green) and DAPI (blue) staining of F3 gys1 WT and gys1 MT embryos at 24 hpf. (b) Unpaired t-test statistical comparison of TUNEL positive rate in gys1 WT and MT embryos at 24 hpf (n = 12, ***P < 0.001), Scale bar = 100 μm. (For interpretation of the references to colour in this figure legend, the reader is referred to the Web version of this article.) |
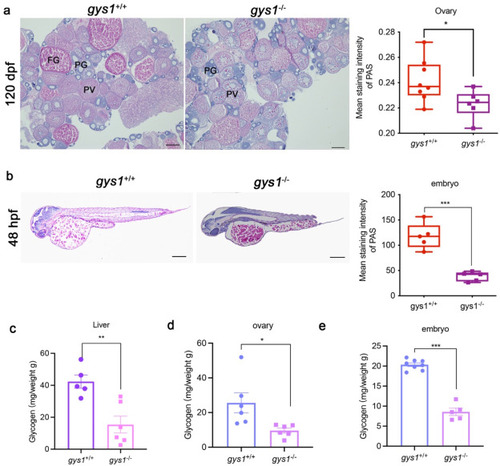
Maternal loss of gys1 caused reduced of ovarian (F2) and embryonic (F3) glycogen reserve. (a) Representative photographes of PAS glycogen staining in ovaries of F2 gys1 WT and gys1 MT (left) in adults; Unpaired t-test statistical analysis of average PAS staining intensity in F2 g gys1 WT and gys1 MT ovarian glycogen staining (right, gys1WT n = 8, gys1MT n = 7, Scale bar = 200 μm *P < 0.05). PG: primary growth stage; PV: pre-vitellogenic stage; FG: full growth stage. (b) Representative photos of PAS glycogen staining in F3 gys1 WT and gys1 MT embryos at 48 hpf (left). Unpaired t-test statistical analysis of average staining intensity analysis of glycogen accumulation in embryos (right, gys1WT n = 5, gys1MT n = 5, Scale bar = 200 μm, ***p < 0.001). (c–e) Glycogen content (mg) per weight (g) analysis of liver (gys1WT n = 5, gys1MT n = 6, **p < 0.01), ovary (gys1WT n = 6, gys1MT n = 6, *p < 0.05) in 180 dpf adults and 24 hpf embryo (gys1WT n = 8, gys1MT n = 8, ***p < 0.001). Unpaired t-test was used as the statistical analysis. |
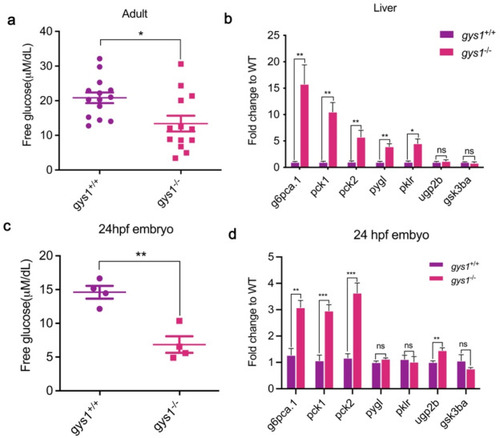
Loss of gys1 impaired the glucose metabolism in zebrafish. (a and c) Plasma free glucose levels in 120 dpf F2 adults (gys1 WT n = 14, gys1 MT zebrafish n = 14) and F3 embryos at 24 hpf (gys1WT n = 4, gys1MT n = 4). (b and d) Loss of gys1 impaired the mRNA levels of glucose metabolism related genes in 120 dpf adult liver (n = 4) and embryos (n = 4), respectively. Unpaired t-test was used as the statistical analysis. Gluconeogenesis genes: g6pc1a.1 glucose-6-phosphatase catalytic subunit 1a; pck1 phosphoenolpyruvate carboxykinase 1; pck2 phosphoenolpyruvate carboxykinase 2 (mitochondrial), Glycolysis genes: pklr pyruvate kinase L/R; pygl phosphorylase, glycogen, liver; Glycogenolysis and glycogen synthesis genes: ugp2b uridine diphosphate glucose pyrophosphorylase; gsk3ba glycogen synthase kinase 3 beta. (*p < 0.05 **p < 0.01 ***p < 0.001 ****p < 0.0001 ns: no significant difference). |
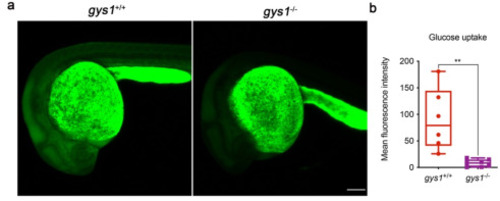
The glucose uptake ability is reduced in F3 gys1 mutant embryos. (a) Representative images showing the glucose uptake after microinjection of 2-NBDG in embryos. (b) Average fluorescent intensity analysis of glucose uptake (gys1WT n = 6, gys1MT n = 7, **p < 0.01). Unpaired t-test was used as the statistical analysis. |
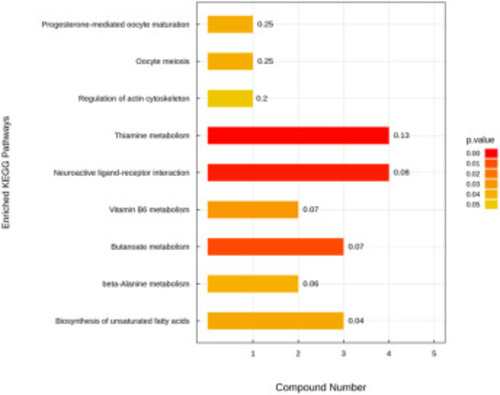
Enriched KEGG pathway analysis revealed by Untargeted metabolomics. KEGG pathway analyzed with MetaboAnalyst 5.0 for the different expressed metabolic profiles between gys1 WT and MT at 24 hpf. p value was determined by Fisher's Exact Test and indicated on the right. Compound number represents to the number of differentially expressed metabolites contained in each KEGG metabolic pathway. |