
Image
|
Figure Caption
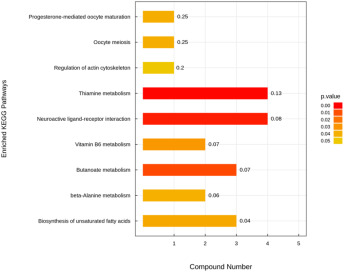
Fig. 6 Enriched KEGG pathway analysis revealed by Untargeted metabolomics. KEGG pathway analyzed with MetaboAnalyst 5.0 for the different expressed metabolic profiles between gys1 WT and MT at 24 hpf. p value was determined by Fisher's Exact Test and indicated on the right. Compound number represents to the number of differentially expressed metabolites contained in each KEGG metabolic pathway.
Acknowledgments
This image is the copyrighted work of the attributed author or publisher, and
ZFIN has permission only to display this image to its users.
Additional permissions should be obtained from the applicable author or publisher of the image.
Full text @ Heliyon