FIGURE SUMMARY
Title

Biological Response Following the Systemic Injection of PEG-PAMAM-Rhodamine Conjugates in Zebrafish

Authors
Custódio, B., Carneiro, P., Marques, J., Leiro, V., Valentim, A.M., Sousa, M., Santos, S.D., Bessa, J., Pêgo, A.P.
Source
Full text @ Pharmaceutics

Kaplan Meier survival analysis after PEG–PAMAM–Rho injection. Probability of survival over time depending on the concentration. Animals were analyzed 4 hpi, 24 hpi, 48 hpi, 72 hpi, and 6 dpi (144 hpi). Statistical analysis was performed using log-rank (Mantel–Cox) test. Statistical data presented are the comparison between vehicle control group and other experimental conditions (**** p < 0.0001).

Morphological alterations in development after PEG–PAMAM–Rho systemic injection. Morphological landmarks over time were analyzed including length (a) and eccentricity (b). At 72 hpi, pericardial area (d), tail–head angle (e), and yolk area (f) were evaluated. Data are presented in box and whisker plots with minimum to maximum shown, and the points represent the data of each individual animal. (a,b) n = 13–48; details in Table S1; (df) n = 6–24; details in Table S2. For (ad), non-parametric tests were performed using Kruskal–Wallis test followed by Dunn’s multiple comparisons test. For (f), one-way ANOVA test was used, followed by Tukey’s multiple comparisons test. Statistical analysis presented is a comparison between the vehicle control group and other experimental conditions in (a,b,e,f). In (d), statistical analysis presented is a comparison between the non-injected control group and other experimental conditions, as well as the vehicle control group and other experimental conditions (* p < 0.05, ** p < 0.01, *** p < 0.001, **** p < 0.0001). (c) Representative brightfield images of the malformations observed at 48 hpi and 72 hpi. Scale bar: 500 µm.

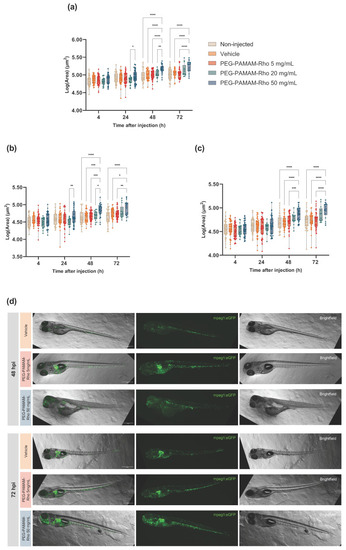
Macrophage response after PEG–PAMAM–Rho injection. Macrophage area in each animal (a), rostral area (b) and caudal area (c). (d) Representative images of macrophages (mpeg1:GFP, green) in the larvae (brightfield) at 48 hpi and 72 hpi: left: merged, middle: mpeg1:EGFP (green), right: animal (brightfield). Scale bar: 500 µm. Data are presented in box and whisker plots with minimum to maximum, and the points represent the data of each individual animal (n = 13–48; details in Table S1). Data were logarithmically transformed to fit a normal Gaussian distribution. Statistical analysis was performed within timepoints to compare different conditions using two-way ANOVA followed by Tukey’s multiple comparisons test (* p < 0.05, ** p < 0.01, *** p < 0.001, **** p < 0.0001).

Behavioral alterations 72 hpi after PEG–PAMAM–Rho injection. Parameters related to locomotion, activity (distance in whole well (a), time immobile (b), mean speed (c), maximum speed (d), and angular velocity (e)), and thigmotaxis (distance travelled in inner (f) and outer zones (g) and time spent in inner zone (h)) were analyzed. Data are presented in box and whisker plots with minimum to maximum, and the points represent the data of each individual animal (n = 38). Statistical analysis was performed using Kruskal–Wallis test followed by Dunn’s multiple comparisons test (ad,fh) or one-way ANOVA test followed Tukey’s multiple comparisons test (e). No significant statistical differences were observed between conditions.

Acknowledgments
This image is the copyrighted work of the attributed author or publisher, and ZFIN has permission only to display this image to its users. Additional permissions should be obtained from the applicable author or publisher of the image. Full text @ Pharmaceutics