
- Title
-
Cell coupling compensates for changes in single-cell Her6 dynamics and provides phenotypic robustness
- Authors
- Doostdar, P., Hawley, J., Chopra, K., Marinopoulou, E., Lea, R., Arashvand, K., Biga, V., Papalopulu, N., Rodriguez, X.S.
- Source
- Full text @ Development
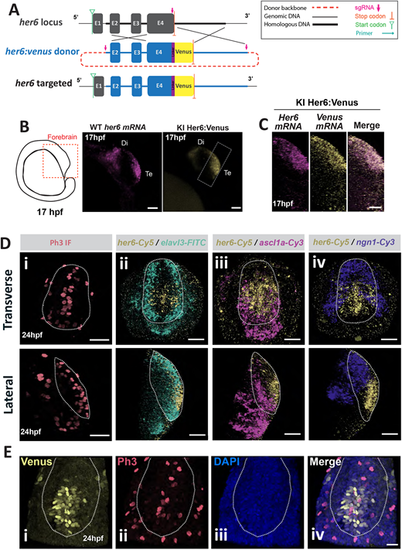
her6 is expressed in a subpopulation of neural progenitor cells in Her6:Venus zebrafish telencephalon. (A) Schematic of the Her6:Venus knock-in design from Soto et al. (2020). (B) Left: schematic depicts the lateral view of zebrafish embryo forebrain at 17 hpf. Middle: maximum intensity projection (MaxIntProj) image of WM FISH of endogenous her6 in wild type (WT) embryo. Right: snapshot of live Her6:Venus (HV) expression in single z-plane from homozygous (HOM) embryo. Di, diencephalon; Te, telencephalon. (C) MaxIntProj images in lateral view from double WM FISH against her6 and venus mRNAs in 17 hpf HOM HV embryo. (D) Images of the telencephalon from 24 hpf HOM HV embryos in transverse (top) and lateral (bottom) view: (i) WM immunofluorescent staining for Phospho-histone H3 (Ph3); (ii) WM FISH against her6/elalv3; (iii) WM FISH against her6/ascl1; (iv) WM FISH against her6/ngn1. (E) Transverse section of the telencephalon in HOM HV embryo at 24 hpf showing immunofluorescence labelling against Her6-Venus (i) and Ph3 (ii) accompanied by DAPI (iii); merged image indicates co-localisation (iv). Dotted contour indicates presumptive Te boundaries. Scale bars: 50 µm (B); 20 µm (C,E); 40 µm (D). |

Her6 expression is heterogeneous across the telencephalon in HV embryos. (A) Schematic of 20 hpf embryo, dashed red line indicates the position of live imaging (left). Transverse view of 3D-reconstructed confocal live images (right) from 20 hpf telencephalon of HV embryo showing HV (yellow) and H2B-mKeima (blue). Dashed contour indicates the telencephalon boundaries. (B) Coefficient of variation (CV) at population level for HV and H2B-mKeima in HV embryos at 20-26 hpf. Boxplots indicate median with interquartile range; dots represent average CV per time point per embryo. (C) 3D-reconstructed snapshot confocal images depicting a single cell expressing HV over time, starting at 20 hpf. (D) HV expression over time of the single cell marked in C. The arrows indicate the time points of snapshots shown in C. The graph also depicts dynamic parameters including intensity mean of a single cell over time (blue dashed line), relative trend (green arrow) and fold-change (red circles). On x-axis 0=20 hpf. (E) Boxplots comparing the CV for each cell trace over time between HV and H2B-mKeima time-series from the same cell. Boxplots indicate median with interquartile range (IQR), whiskers indicate maximum (maximum value in the data, Q3 +1.5× IQR) and minimum (minimum value in the data, Q1 + 1.5× IQR) points, dots represent outliers. (F) Comparison of relative trend between HV and H2B-mKeima obtained from the same cell trace. Values >1 indicate upregulation, values=1 indicate steady expression and values <1 indicate downregulation. Bars indicate median with interquartile range, circles represent cells. (G) Representative examples of oscillatory and non-oscillatory HV time-series (i) with corresponding H2B-mKeima traces (ii) obtained from the same nuclei. Corresponding HV traces after being divided by H2B-mKeima (iii, HV/H2B normalised). Normalised traces after removing the long-term trend (iv, HV/H2B detrended). (H) Comparison of peak-to-trough fold-change in HV/H2B (Her6:Venus/H2B-mKeima) versus H2B (H2B-mKeima) collected in the same nuclei. Bars indicate median and interquartile range; each dot is median per embryo. (I) Aggregate power spectral density (PSD) obtained from time-series HV, HV/H2B and nuclear control H2B-mKeima from one experiment. (J) Percentage of oscillators in detrended HV/H2B versus H2B control. Bars indicate median, each dot indicates median per embryo. (K,L) HV period and peak-to-trough fold-change from HV/H2B detrended single cells. Bars indicate median and interquartile range, dots indicate cells. *P≤0.05; **P≤0.01; ****P≤0.0001 (statistical test details found in Table S6). Scale bars: 20 µm (A); 5 µm (C). |
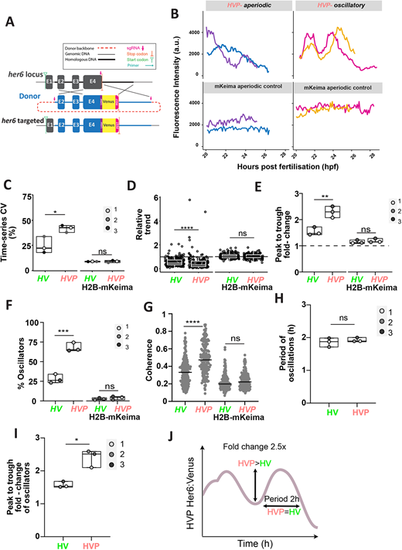
Her6 expression dynamics in single cells are altered when the protein is destabilised. (A) Schematic of the Her6:Venus-PEST (HVP) knock-in design. CRISPR/Cas9-mediated HDR resulted in the insertion of the KI cassette including Venus and PEST into the endogenous locus. Detailed description is presented in Fig. S3A,B. (B) Representative examples of Venus oscillatory (HVP-oscillatory) and Venus non-oscillatory (HVP-aperiodic) and their corresponding H2B-mKeima time-series obtained from HVP embryos at 20-30 hpf. (C) Comparison of time-series CV from raw single-cell Venus and H2B-mKeima observed in HV versus HVP. ns: P=0.9381. (D) Relative trend of Venus and H2B-mKeima raw time-series in HV versus HVP embryos. Values >1 indicate upregulation, values=1 indicate steady expression and values <1 indicate downregulation. Circles represent individual cells. ns: P=0.4207. (E) Peak-to-trough fold-change in oscillators expressing raw Venus and their respective mKeima compared in HV and HVP embryos. ns: P=0.4798. (F) Percentage of oscillators in HV versus HVP embryos. Cells expressing Venus (HV and HVP, respectively) and mKeima (H2B-mKeima from the respective HV and HVP embryos). ns: P=0.3609. (G) Coherence values observed in Venus and mKeima compared between HV and HVP time-series. Dots represent individual cells, line indicates median. ns: P=0.8239. (H,I) Period and peak-to-trough fold-change of oscillatory HV versus HVP expression. ns: P=0.3165. (C-I) Boxes indicate median with interquartile range. Dots represent median per embryo in C,E-I. (J) Diagram representation of the main features of HVP oscillations. *P≤0.05; **P≤0.01; ***P≤0.001; ****P≤0.0001 (statistical test details found in Table S6). ns, not significant. |
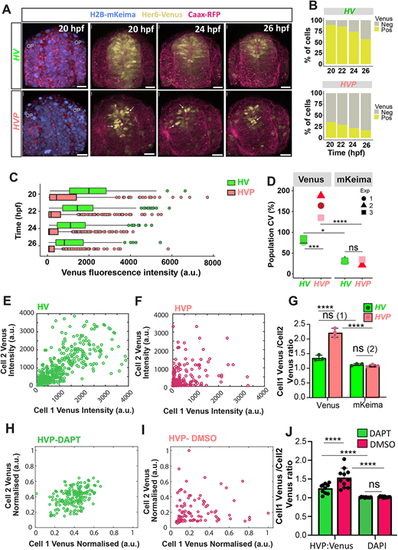
Spatial heterogeneity in Her6:Venus expression is altered in embryos with destabilised protein. (A) Representative examples of 3D-reconstructed confocal images of the transverse view of the telencephalon in Her6:Venus (HV; top panels) and Her6:Venus-PEST (HVP; bottom panels) embryos at 20-26 hpf showing HV and HVP expression (yellow), nuclei (H2B-mKeima, blue) and membranes (CAAX-RFP, red). Arrows indicate highly expressing HVP cells. OP, olfactory placode. (B) Percentage of Venus-expressing cells in HV versus HVP from a single experiment. (C) Distribution of nuclear HV and HVP at 20-26 hpf (temporal breakdown by repeat in Fig. S5C). Markers represent individual nuclei per time point, boxes indicate median and interquartile range. (D) Comparison of population CV obtained from Venus (HV and HVP) and H2B-mKeima expression from HV and HVP embryos (temporal breakdown by repeat in Fig. S5D). (E,F) Local intensity mapping of Venus in neighbouring cells observed in HV (E) and HVP (F) embryonic telencephalon imaged simultaneously at 24 hpf. Dots indicate intensities in individual nuclei (Cell 1) that were paired with their nearest neighbour (Cell 2) based on 3D Euclidean distance. (G) Intensity ratios observed in neighbouring cells (see E,F) showing Venus and H2B-mKeima quantified in HV versus HVP embryos at 20-26 hpf. Bars indicate mean±s.d., dots represent mean per embryo. ns (1): P=0.0901; ns (2): P=0.9989. (H,I) Local intensity mapping of Venus in neighbouring cells observed in DAPT- (H) and DMSO- (I) treated HVP embryos at 24 hpf. Dots indicate intensities in individual nuclei (Cell 1) that were paired with their nearest neighbour (Cell 2) based on 3D Euclidean distance. (J) Average intensity ratios observed in neighbouring cells (see H,I) showing Venus and H2B-mKeima quantified in HVP embryos at 24 hpf treated with DAPT versus DMSO. Bars indicate mean±s.d., dots represent mean per embryo. ns: P>0.9999. *P≤0.05; ***P≤0.001; ****P≤0.0001 (statistical test details found in Table S6). ns, not significant. Scale bars: 30 µm. |
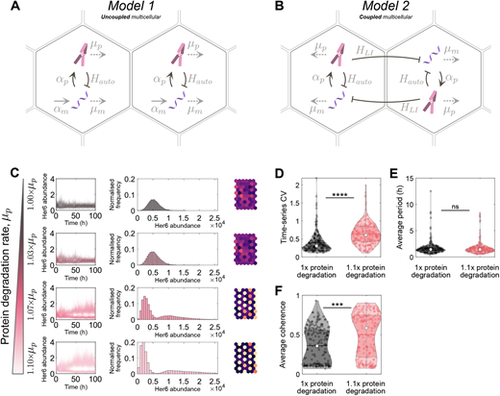
Single and multicellular models of Her6 protein expression with normal and altered protein stability. (A) Model 1: a stochastic single-cell model that explicitly models mRNA and protein. αp and αm are protein and mRNA synthesis rates, respectively, and μp and μm are the degradation rates. Hauto is the Hill function used for the direct repressive action of Her6 protein on its own mRNA production, which has an associated time delay (Table S1). (B) Model 2: the same as Model 1 but extended to a multicellular model. Cells are coupled bidirectionally with a repressive Hill function, HLI, that has an associated time delay and represents Notch-Delta lateral inhibition signalling. For all simulations, both models were run as a hexagonal grid of 10 rows by 6 columns. (C) Her6 expression from Model 2 run with a parameter set contained within the accepted optimiser parameter sets. Each row corresponds to a different protein degradation rate (indicated on the left, ranging between 1× and 1.1×). The first column shows the time-series of every cell for the full simulation. The second column shows histograms of Her6 abundance taken from the second half of the simulations. The third column shows the final time point of each simulation plotted on a hexagonal grid in which colour indicates Her6 expression in each cell (lighter colours indicate higher expression). (D) Time series coefficient of variation (CVt) plotted at normal and 1.1× degradation. For normal degradation rate, median CVt=0.30 (white dot), and for 1.1× degradation, median CVt=0.61. Kruskal–Wallis statistical test showed a significant difference in the distributions, P=1.3×10⁻²⁰. (E) Median temporal period for each parameter set. Median period was 141 h in both cases. Kruskal–Wallis statistical test showed no significant difference in the distributions, P=0.55. (F) Median coherence for each parameter set. Median coherence for normal degradation was 0.36, and for 1.1× degradation coherence was 0.58. Kruskal–Wallis statistical test showed a significant difference in the distributions, P=1.5×10⁻⁸. ***P≤0.001; ****P≤0.0001. ns, not significant |
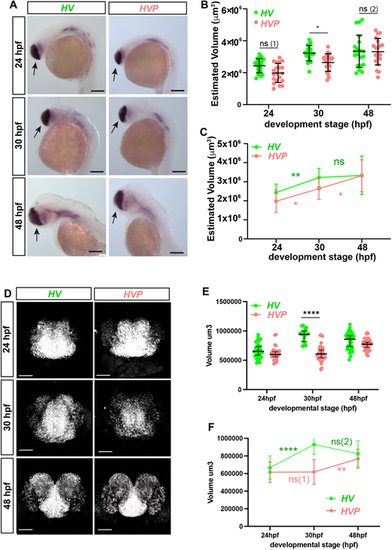
The size of telencephalon in HV and HVP embryos at 24, 30 and 48 hpf. (A) WM Chromogenic ISH showing foxg1 mRNA expression in HV and HVP at specific stages. Black arrows: telencephalon. (B) 3D volumetric comparison of telencephalon size (calculated using length, depth and width measurements from data in A; see also Fig. S8A-E) in HV versus HVP from 24 to 48 hpf. Bars indicate mean±s.d., dots indicate individual embryos. ns (1): P=0.1104; ns (2): P>0.99. (C) Comparison of the changes in telencephalic volume over time. Spots and bars indicate the mean±s.d. ns: P>0.99. (D) Representative examples of in situ hybridization chain reaction (HCR) for foxg1 mRNA observed in HV versus HVP embryos at 24, 30 and 48 hpf. (E) Volume measurements of telencephalon region marked by foxg1 from data in D observed in HV and HVP embryos at different stages. Bars indicate median and 95% CI, dots indicate individual embryos. ns: P>0.99. (F) Comparison of telencephalon volume growth rates in HV and HVP embryos (data from E). Spots indicate mean, bars indicate s.d. ns (1): P>0.99; ns (2): P=0.6064. *P≤0.05; **P≤0.01; ****P≤0.0001 (statistical test details found in Table S6). ns, not significant. Scale bars: 150 µm (A); 50 µm (D). |

The phenotypic effect of destabilising Her6 protein is negligible in 24 hpf embryos but becomes more evident by 48 hpf. (A-C) qPCR quantification of mRNA expression level observed in elavl3 (A), ngn1 (B) and ascl1 (C) between HV (green) and HVP (pink) in dissected telencephalon of 24 and 48 hpf embryos. Boxes indicate median and interquartile range. Whisker endpoints indicate 25th percentile−1.5× interquartile range and 75th percentile+1.5× interquartile range. ns: P>0.05. (D,E) Representative examples of elavl3 (D) and ngn1 (E) mRNA visualised using HCR in HV and HVP forebrain at 24 and 48 hpf. Frontal view. Red arrows indicate telencephalic region. Yellow dashed line indicates embryonic outline. (F,G) Double HCR was performed on each embryo for elavl3 or ngn1 with foxg1. Relative volume was calculated as a ratio of the respective gene with foxg1. (F) Relative volume elavl3/foxg1 compared between HV and HVP embryos at different stages. (G) Relative volume of ngn1/foxg1 compared between HV and HVP embryos at different stages. (H-K) Quantification of mRNA by qPCR showing the expression level of pallial glutamatergic markers, vglut2a and tbr1 (H,I), and sub-pallial GABAergic markers, gad1 and gad2 (J,K). Boxes indicate median and interquartile range. Whisker endpoints indicate 25th percentile−1.5× interquartile range and 75th percentile+1.5× interquartile range. ns: P>0.05. (L,M) Representative examples of vglut2a (M) and gad1 (N) mRNA visualised using HCR in HV and HVP forebrain at 24 and 48 hpf. Frontal view in L and M, 48 hpf. Lateral view in M, 24 hpf. Red arrows indicate telencephalic region. Yellow dashed line indicates embryonic area. (N,O) Double HCR was performed on each embryo for vglut2a or gad1 with foxg1. Relative volume was calculated as a ratio of the respective gene with foxg1. (N) Relative volume of vglut2a/foxg1 compared between HV and HVP embryos at different stages. (O) Relative volume of gad1/foxg1 compared between HV and HVP embryos at different stages. *P≤0.05; **P≤0.01; ***P≤0.001; ****P≤0.0001 (statistical test details found in Table S6). Scale bars: 50 µm. |