
Fig. 1
- ID
- ZDB-FIG-240614-22
- Publication
- Doostdar et al., 2024 - Cell coupling compensates for changes in single-cell Her6 dynamics and provides phenotypic robustness
- Other Figures
- All Figure Page
- Back to All Figure Page
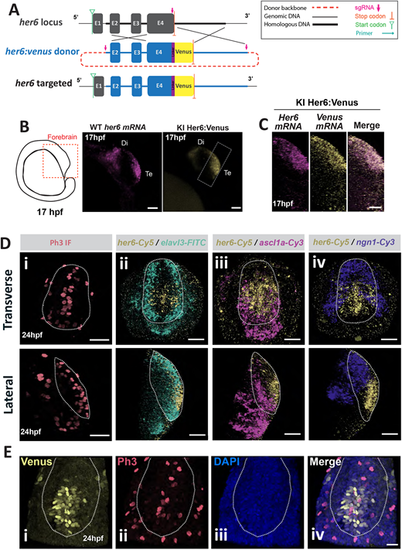
her6 is expressed in a subpopulation of neural progenitor cells in Her6:Venus zebrafish telencephalon. (A) Schematic of the Her6:Venus knock-in design from Soto et al. (2020). (B) Left: schematic depicts the lateral view of zebrafish embryo forebrain at 17 hpf. Middle: maximum intensity projection (MaxIntProj) image of WM FISH of endogenous her6 in wild type (WT) embryo. Right: snapshot of live Her6:Venus (HV) expression in single z-plane from homozygous (HOM) embryo. Di, diencephalon; Te, telencephalon. (C) MaxIntProj images in lateral view from double WM FISH against her6 and venus mRNAs in 17 hpf HOM HV embryo. (D) Images of the telencephalon from 24 hpf HOM HV embryos in transverse (top) and lateral (bottom) view: (i) WM immunofluorescent staining for Phospho-histone H3 (Ph3); (ii) WM FISH against her6/elalv3; (iii) WM FISH against her6/ascl1; (iv) WM FISH against her6/ngn1. (E) Transverse section of the telencephalon in HOM HV embryo at 24 hpf showing immunofluorescence labelling against Her6-Venus (i) and Ph3 (ii) accompanied by DAPI (iii); merged image indicates co-localisation (iv). Dotted contour indicates presumptive Te boundaries. Scale bars: 50 µm (B); 20 µm (C,E); 40 µm (D). |