- Title
-
Nkd1 functions downstream of Axin2 to attenuate Wnt signaling
- Authors
- Bell, I., Khan, H., Stutt, N., Horn, M., Hydzik, T., Lum, W., Rea, V., Clapham, E., Hoeg, L., Van Raay, T.J.
- Source
- Full text @ Mol. Biol. Cell
|
Wnt regulator mutants have developmental defects. (A) 2 dpf Zebrafish embryos were observed for heart looping phenotypes and quantified in (B). (C) Zebrafish were treated with PTU from 1–5 dpf and then fixed at 5 dpf for neuromast staining with terminal neuromasts highlighted by the red box and quantified in (D). (E) Maternal-zygotic adult axin2gh1/gh1 zebrafish occasionally develop a curved spine phenotype. (F) Adults from a heterozygous incross were phenotyped for the curved spine followed by genotyping. (G) Maternal-zygotic adult axin2gh1/gh1 zebrafish often have a receding operculum phenotype. (H) Adults from a heterozygous incross were phenotyped for the receding operculum followed by genotyping. Error bars represent SEM, and a Chi-Square analysis was used with **** = p value < 0.0001. |
|
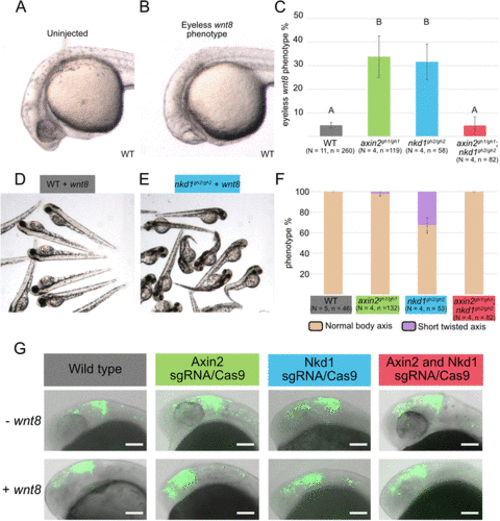
Wnt regulator mutants have differential sensitivities to exogenous Wnt8. (A–C) Overexpression of 100 pg of wnt8 in wild type embryos results in the classic Wnt gain of function eyeless phenotype in ∼ 5% of embryos, but more than 30% in axin2gh1/gh1 and nkd1gh2/gh2 mutants. Small eyes were considered to have eyes. In contrast, the axin2gh1/gh1;nkd1gh2/gh2 resembles the wild-type phenotype (C). (D–F) Analysis of body axis development revealed that only the nkd1gh2/gh2 mutants develop a short-twisted axis with exogenous wnt8 in about 30% of the embryos. (G) The Wnt reporter line was used to assess Wnt activity at the midbrain-hindbrain boundary at 1dpf when either Axin2 and/or Nkd1 was knocked down using sgRNA/Cas9. In each of the sgRNA/Cas9 injections there was an expansion of Wnt activity in the forebrain when compared with wild type embryos. Single plane brightfield images were overlaid with composite GFP images and as such the eye is not visible in all images. Error bars represent SEM, different letters above the bar signify significance with a p value < 0.01 using a one-way ANOVA. |
|
axin2gh1/gh1;nkd1gh2/gh2 mutants are sensitive to activation at the destruction complex level. (A) Embryos were treated with varying concentrations of BIO from 4 – 30 hpf with representative images taken of the wild type embryos. (B) In wild type embryos, the area of the eye has a decreasing linear association with the concentration of BIO with all embryos being eyeless at 1.5 µM. In contrast, the majority of the axin2gh1/gh1;nkd1gh2/gh2 mutant embryos were eyeless at 0.5 µM of BIO. (C) The axin2gh1/gh1;nkd1gh2/gh2 mutant has no change in the size of eye in the control treatment but has significantly smaller eyes at 0.5 µM of BIO when compared with wild type revealing that the axin2gh1/gh1;nkd1gh2/gh2 mutants are sensitive to BIO. Measurements were performed on imageJ and a t test was used with ** = p value < 0.01. All error bars represent SEM. No statistics were performed on the axin2gh1/gh1 and nkd1gh2/gh2 single mutants. |
|
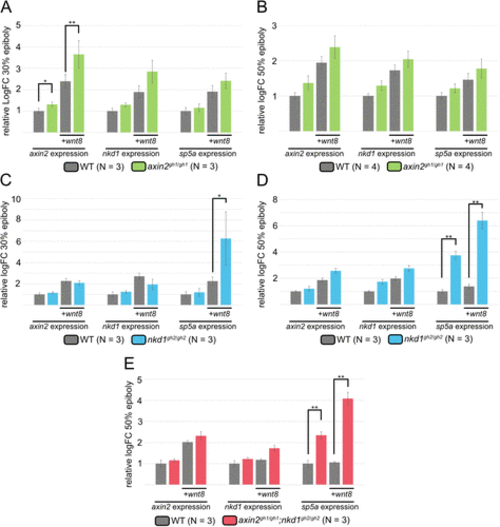
Wnt regulator mutants have differential effects on Wnt target genes. qRT-PCR was performed at 30% (A and C) and 50% (B, D, and E) epiboly for the Wnt target genes axin2, nkd1, and sp5a. Target gene expression was normalized to actin and made relative to WT uninjected expression levels. Injections were performed with 100 pg of wnt8 at the one cell stage. Expression of axin2, nkd1, and sp5a tended to increase in axin2gh1/gh1 mutants at both 30 and 50% epiboly but only axin2 expression increased significantly at 30% epiboly. However, in the nkd1gh2/gh2 and axin2gh1/gh1;nkd1gh2/gh2 mutants, axin2 and nkd1 expression did not increase substantially compared with wild type. In contrast, sp5a expression showed a significant increase at 30 and 50% epiboly in the nkd1gh2/gh2 mutants and at 50% in the axin2gh1/gh1;nkd1gh2/gh2 (A–E, error bars represent SEM, * = p value < 0.05, ** = p value < 0.01, one-way ANOVA). Injection of Wnt8 into wild type (column 3) is often significant to uninjected wild type (column 1), but this is not shown for clarity. |
|
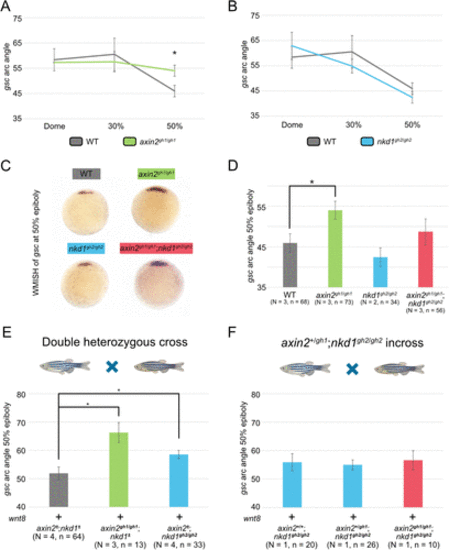
Wnt regulator mutants have differential effects on gsc expression. (A–D) WMISH for gsc was performed on embryos at three different stages for axin2gh1/gh1 and nkd1gh2/gh2 single mutants (A and B) as well as 50% epiboly for all Wnt regulator mutants (C) and measured for the arc of gsc expression (D). At 50% epiboly, the arc angle of gsc expression was significantly broader in the axin2gh1/gh1 embryos, which was not seen in either nkd1gh2/gh2 or axin2gh1/gh1;nkd1gh2/gh2 mutants. (E and F) Analysis of gsc expression on embryos at 50% epiboly injected with 100 pg of wnt8 from either an axin2+/gh1;nkd1+/gh2 incross (E) or an axin2+/gh1;nkd1gh2/gh2 incross (F). (E) The axin2gh1/gh1;nkd1± and axin2±;nkd1gh2/gh2 embryos had an increase in gsc arc angle when compared with axin2±;nkd1± . (F) In contrast, axin2gh1/gh1;nkd1gh2/gh2 double mutant embryos showed no increase in gsc arc angle when compared with the single knockout genotypes. Injections were performed at the one cell stage and arc angle measurements were taken on ImageJ. Embryos were genotyped using indel detection by amplicon analysis and PCR based methods. A one-way ANOVA was used for all statistics with * = p value < 0.05, error bars represent SEM (A, B, C, and E) and SD (F). |
|
axin2gh1/gh1;nkd1gh2/gh2 embryos have a more similar RNA profile to nkd1gh2/gh2 than to axin2gh1/gh1 . RNA-seq was performed at 50% epiboly for all Wnt regulator mutants as well as two wild type background genotypes: TU and TL. (A) PCA analysis and a (B) heat map analysis of the top 1000 differentially regulated genes shows that that axin2gh1/gh1;nkd1gh2/gh2 double mutant embryos have a similar RNA profile to the nkd1gh2/gh2 single mutant embryos. (C–D) Venn diagrams were made for upregulated genes (C) (log2FC > 2 and an FDR < 0.05) and down regulated genes (D) (log2FC < -2 and an FDR < 0.05) with genes that were significantly different (FDR < 0.05) between TL and the TU backgrounds being removed. (E) A gene list for the 34 genes that were upregulated and the 15 genes that were down regulated for each of the Wnt regulator mutants was made with the log fold change values provided for comparison. For more information on DEG for each Wnt regulator mutant refer to Supplemental Tables 6–9. |
|
Knocking out Axin2, but not Nkd1, increases cytoplasmic levels of β-catenin. (A) Whole cell lysate and cytoplasmic fractions of embryos from wild type and Wnt regulator mutants, with or without 200 pg of wnt8 injected, were collected at 30% epiboly for western blot analysis for cytoplasmic levels of β-catenin. Pan-cadherin was used to confirm purity of the cytoplasmic fraction and Actin was used as a loading control. (B) Because each genotype was run on separate western blots, the increase in cytoplasmic β-catenin when wnt8 was overexpressed was made relative to their uninjected counterpart. Both axin2gh1/gh1 and axin2gh1/gh1;nkd1gh2/gh2 embryos had a greater increase in cytoplasmic β-catenin levels with wnt8 overexpression when compared with wild type embryos. Error bars represent SEM, * = p value < 0.05, one-way ANOVA. |
|
Wnt signaling mutants have lower expression of metabolism proteins. Mass spectrometry was performed on embryos at 30% epiboly. (A) Only samples with similar total ionic chromatograms were used, resulting in only one biological replicate for each genotype. (B) Heat map of 53 differentially expressed proteins using PEAKS 10 software (FDR < 0.1, logFC ≥ 1, peptides ≥ 2). (C) Eighteen proteins were identified to have a connection to Wnt signaling in the literature: Fabp3 (Liu et al., 2013), Aldh2.2 (Zhao et al., 2015), Prdx1 (Zheng et al., 2018), Idhba (Mazzio et al., 2020), Pcxa (Lee et al., 2012), Tcp1 (Tang et al., 2020), Igf2bp3 (Song et al., 2023), Pkma (Lu et al., 2021), Actb2 (Gu et al., 2021), Cct5 (Li et al., 2022b), Prdx6 (Xu et al., 2019), Tpi1a (Xia et al., 2023), Prdx2 (Feng et al., 2020), Ppa1b (Niu et al., 2017), Sod1 (Chandrasekharan et al., 2021), Cox17 (Li et al., 2022a), Ranbp1 (Liu et al., 2019), Stmn1a (Zhang et al., 2019). (D and E) String protein networks were created using all proteins identified (D) and a network of the 39 nonribosomal proteins (E). |


