Fig. 5
- ID
- ZDB-FIG-240621-40
- Publication
- Bell et al., 2024 - Nkd1 functions downstream of Axin2 to attenuate Wnt signaling
- Other Figures
- All Figure Page
- Back to All Figure Page
|
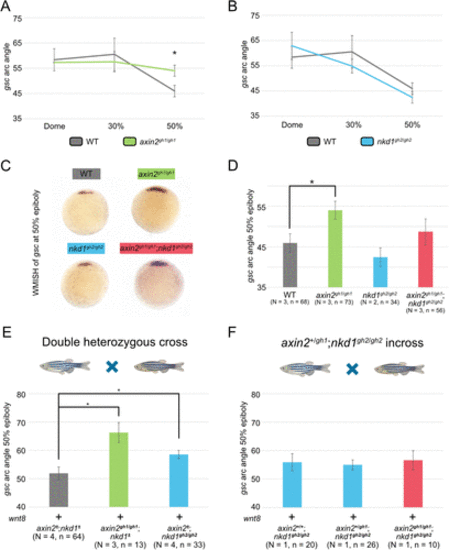
Wnt regulator mutants have differential effects on gsc expression. (A–D) WMISH for gsc was performed on embryos at three different stages for axin2gh1/gh1 and nkd1gh2/gh2 single mutants (A and B) as well as 50% epiboly for all Wnt regulator mutants (C) and measured for the arc of gsc expression (D). At 50% epiboly, the arc angle of gsc expression was significantly broader in the axin2gh1/gh1 embryos, which was not seen in either nkd1gh2/gh2 or axin2gh1/gh1;nkd1gh2/gh2 mutants. (E and F) Analysis of gsc expression on embryos at 50% epiboly injected with 100 pg of wnt8 from either an axin2+/gh1;nkd1+/gh2 incross (E) or an axin2+/gh1;nkd1gh2/gh2 incross (F). (E) The axin2gh1/gh1;nkd1± and axin2±;nkd1gh2/gh2 embryos had an increase in gsc arc angle when compared with axin2±;nkd1± . (F) In contrast, axin2gh1/gh1;nkd1gh2/gh2 double mutant embryos showed no increase in gsc arc angle when compared with the single knockout genotypes. Injections were performed at the one cell stage and arc angle measurements were taken on ImageJ. Embryos were genotyped using indel detection by amplicon analysis and PCR based methods. A one-way ANOVA was used for all statistics with * = p value < 0.05, error bars represent SEM (A, B, C, and E) and SD (F). |

