
- Title
-
Stat3 regulates developmental hematopoiesis and impacts myeloid cell function via canonical and non-canonical modalities
- Authors
- Sobah, M.L., Liongue, C., Ward, A.C.
- Source
- Full text @ J. Innate Immun.

Generation of zebrafish Stat3 mutants. Schematic of the STAT3 protein outlining the various functional domains: N-terminal, CCD (coiled-coil domain), DBD (DNA binding domain), linker, SH2 (Src homology 2 domain), and TAD (transactivation domain), along with relevant sections of the zebrafish stat3 gene showing introns (black lines) and exons (colored boxes) encoding the indicated protein domains as well its targeting by sgRNAs (a). Sequence traces of representative homozygous wild-type (WT, stat3wt/wt) and knockout (KO, stat3ko/ko) (b) and WT and transactivation domain truncation (ΔTAD, stat3Δtad/Δtad) (c) mutant fish, with nucleotides and corresponding amino acids shown. In each case, nucleotide sequences deleted are boxed in purple with de novo amino acids in red. Schematic of Stat3 proteins expressed in WT, KO, and ΔTAD fish (d). |

Effect of Stat3 mutations on primitive hematopoiesis. Representative images of wild-type (WT), knockout (KO), and transactivation domain truncation (ΔTAD) mutant embryos subjected to WISH at 12 hpf with scl (a-c, e-g), at 16 hpf with gata1a (i-k) and spi1b (m-o) and at 22 hpf with hbbe1.1 (q-s), mpx (u-w), and csf3r (y-a′) using light microscopy or those on a Tg(mpeg1.1:GFP) transgenic background at 22 hpf (c′-e′) using fluorescence microscopy. Scale bars represent 200 μm. Quantification of area of staining for scl (d, h), gata1a (l), spi1b (p), and hbbe1.1 (t) and cell numbers for mpx (x), csf3r (b′), and mpeg1.1 (f′) showing values for individual embryos as well as mean and SEM with statistical significance between genotypes indicated (***p < 0.001, **p < 0.01, *p < 0.05, ns: not significant). |

Effect of Stat3 mutations on early definitive hematopoiesis. Representative images of wild-type (WT), knockout (KO), and transactivation domain truncation (ΔTAD) mutant embryos subjected to WISH at 3.5 dpf with cmyb (a-c, e-g) and ikzf1 (i-k) and at 5 dpf with rag1 (m-o), tcra (q-s), hbbe1.1 (u-w), mpx (y-a′), and csf3r (c′-e′) using light microscopy or those on a Tg(mpeg1.1:GFP) transgenic background at 5 dpf (g′-i′) using fluorescence microscopy. Scale bars represent 200 μm. Quantification of area of staining for cmyb (d, h), ikzf1 (l), rag1 (P), tcra (t), and hbbe1.1 (x), and cell numbers for mpx (b′), csf3r (f′), and mpeg1.1 (j′) showing values for individual embryos as well as mean and SEM with statistical significance between genotypes indicated (***p < 0.001, **p < 0.01, *p < 0.05, ns: not significant). |

Effect of Stat3 mutations on the response of neutrophils and macrophages to injury. Wild-type (WT), knockout (KO), and transactivation domain truncation (ΔTAD) mutant embryos on either the Tg(mpx:GFP) or Tg(mpeg1.1:GFP) transgenic background were subjected to a caudal fin wounding assay at 3 dpf and imaged using fluorescence microscopy from 0 to 24 h post wounding (hpw) (a). Representative images of mpx+ neutrophil (b) and mpeg1.1+ macrophage (e) cells migrating to the vicinity of the injury site (dotted line) at the indicated times, with scale bars of 100 μm. Quantitation of total migrating mpx+ cells (c) or normalized relative to overall mpx+ cells (d), as well as total migrating mpeg1.1+ cells (f) or normalized relative to overall mpeg1.1+ cells (g) (n = 5). Gene expression analysis of the indicated genes in WT, KO, and ΔTAD embryos (n = 5–6) at 4 hpw presented as fold change (log2) relative to WT (h). c, d, f-h show mean and SEM with statistical significance indicated compared to WT (***p < 0.001, **p < 0.01, *p < 0.05), between mutants (@@@p < 0.001, @@p < 0.01, @p < 0.05) or between unwounded and wounded (###p < 0.001, ##p < 0.01, #p < 0.05), identified using a two-way ANOVA with Tukey’s multiple comparison test. |

Effect of Stat3 mutations on the response to LPS. Wild-type (WT: a, d, g, j), knockout (KO: b, e, h, k) and transactivation domain truncation (ΔTAD: c, f, i, l) mutant 3 dpf embryos on either the Tg(mpx:GFP) (a–f) or Tg(mpeg1.1:GFP) (g-l) transgenic background were left uninjected (a–c, g–i) or subjected to injection with lipopolysaccharide (LPS) (d–f, j–k) and imaged 8 h post injection showing representative images with scale bars of 100 μm. Quantitation of mpx+ cells (m) and mpeg1.1+ cells (n) showing values for individual embryos. Gene expression analysis of the indicated genes in LPS-injected WT, KO and ΔTAD embryos (n = 6) presented as fold-change (log2) relative to uninjected (o). Show mean and SEM with statistical significance indicated between genotypes (m, n) or compared to WT (o) (***p < 0.001, *p < 0.05, ns: not significant), or between uninjected and injected (##p < 0.01, #p < 0.05). |

Effect of Stat3 mutations on the response to G-CSF. Wild-type (WT: a, d), knockout (KO: b, e) and transactivation domain truncation (ΔTAD: c, f) mutant 1 cell embryos on the Tg(mpx:GFP) transgenic background were left uninjected (a–c) or subjected to injection with mRNA encoding the zebrafish G-CSF paralogue, Csf3a, and imaged 3 days post injection showing representative images with scale bars of 100 μm. Quantitation of mpx+ cells (g) showing values for individual embryos. Gene expression analysis of the indicated genes in Csf3a-injected WT, KO and ΔTAD embryos (n = 6) presented as fold-change (log2) relative to WT (h). g, h show mean and SEM with statistical significance indicated between genotypes (g) or compared to WT (h) (***p < 0.001, **p < 0.01, ns: not significant) or between uninjected and injected (###p < 0.01, ##p < 0.01, #p < 0.05). |
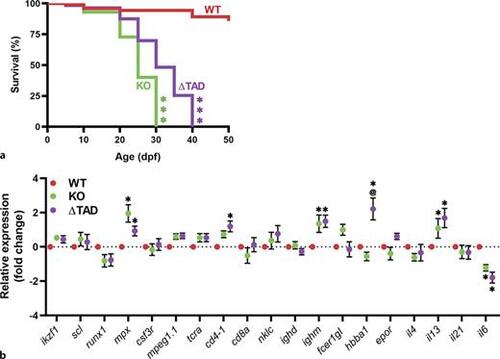
Effect of Stat3 mutations on juvenile survival and immune cell development. Relative survival of wild-type (WT), knockout (KO), and transactivation domain truncation (ΔTAD) mutant zebrafish displayed as a Kaplan-Meier curve (n = 15–30) (a). Gene expression analysis of the indicated genes in 28 dpf WT, KO and ΔTAD juveniles (n = 6–12) showing mean and SEM (b). Statistical significance is indicated compared to WT (**p < 0.01, *p < 0.05) or between mutants (@@p < 0.01, @p < 0.05). |

Model for the role of Stat3 in the development and function of neutrophils. Schematic representation of signaling downstream of Csf3r and Cxcr2. Activation of Csf3r by either Csf3a or Csf3b induces canonical activation of Stat3 to mediate primitive and definitive granulopoiesis and is negatively regulated by Socs3b. Non-canonical Stat3 stimulated by Csf3a induces transcription of cxcr2 to facilitate emergency granulopoiesis. Stimulation of Cxcr2 by Cxcl8b drives a positive feedback loop which increases transcription of cxcl8b to mediate neutrophil migration. |