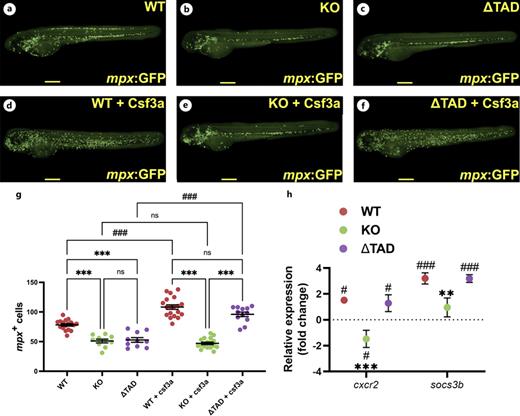
Fig. 6 Effect of Stat3 mutations on the response to G-CSF. Wild-type (WT: a, d), knockout (KO: b, e) and transactivation domain truncation (ΔTAD: c, f) mutant 1 cell embryos on the Tg(mpx:GFP) transgenic background were left uninjected (a–c) or subjected to injection with mRNA encoding the zebrafish G-CSF paralogue, Csf3a, and imaged 3 days post injection showing representative images with scale bars of 100 μm. Quantitation of mpx+ cells (g) showing values for individual embryos. Gene expression analysis of the indicated genes in Csf3a-injected WT, KO and ΔTAD embryos (n = 6) presented as fold-change (log2) relative to WT (h). g, h show mean and SEM with statistical significance indicated between genotypes (g) or compared to WT (h) (***p < 0.001, **p < 0.01, ns: not significant) or between uninjected and injected (###p < 0.01, ##p < 0.01, #p < 0.05).
Image
Figure Caption
Acknowledgments
This image is the copyrighted work of the attributed author or publisher, and
ZFIN has permission only to display this image to its users.
Additional permissions should be obtained from the applicable author or publisher of the image.
Full text @ J. Innate Immun.

