FIGURE SUMMARY
Title

Identification of Dhx15 as a Major Regulator of Liver Development, Regeneration, and Tumor Growth in Zebrafish and Mice

Authors
Portolés, I., Ribera, J., Fernandez-Galán, E., Lecue, E., Casals, G., Melgar-Lesmes, P., Fernández-Varo, G., Boix, L., Sanduzzi, M., Aishwarya, V., Reig, M., Jiménez, W., Morales-Ruiz, M.
Source
Full text @ Int. J. Mol. Sci.

Dhx15 gene deficiency in zebrafish resulted in a liverless phenotype. (A) In the upper panels, representative images of wild-type (panel a) and Dhx15−/− (panel b) larvae at 5 day post fertilization (dpf) revealing an absence of liver development and metabolite retention in the yolk sac. Each area is enclosed with different colors (yellow lines correspond to liver region and green lines to yolk sac). In the lower panels, positive liver red fluorescence in wild-type (panel c) and Dhx15−/− (panel d) larvae. Quantification of liver size is shown in adjacent graph. Bars represent the mean ± SEM, *** p < 0.001 vs. wild-type zebrafish (n = 15). (B) RNA extraction of zebrafish embryos at 4 dpf from either wild-type or Dhx15 knockout larvae was performed. mRNA expression was analyzed by RT-qPCR. The graph shows the expression levels of the Mypt1, Prox1, Hdac3, Gata6, Foxa1, Sox17, Uhrf1, and Bmp4 genes in the Dhx15+/+ and Dhx15−/− conditions. mRNA levels are shown as fold change relative to Actin mRNA levels. Bars represent the mean ± SEM, * p < 0.05 vs. wild-type(n = 4). N.S. not significant. (C) Representative images comparing wild-type and Dhx15−/− larvae at 7 dpf; Dhx15−/− larvae show absence of liver (red fluorescence) and morphological defects including encephalic and cardiac edema, scoliosis, and impaired neural/eye growth.

Intrahepatic liver vasculature was altered in Dhx15+/− mice. (A) Representative Cd31 liver immunostaining (green) for wild-type (panel a) and Dhx15+/− (panel b) mouse. Nuclei counterstaining was performed with DAPI (blue). Confocal microscope, original magnification: 300×. (B) RNA extraction of liver tissue from either wild-type or Dhx15+/− mice was performed. mRNA expression was analyzed by RT-qPCR. The graphs show the expression levels of Vegf-a, Vegf-c, Vegf-d, Vegfr1, Vegfr3, Podoplanin, and Angiopoietin 1 genes in the wild-type and Dhx15+/− conditions. mRNA levels are shown as fold change relative to Hprt mRNA levels. Bars represent mean ± SEM, * p < 0.05 vs. wild-type (n = 4). (C) RNA extraction of the hepatocyte cell line without or with silenced Dhx15 gene was performed. mRNA expression was analyzed by RT-qPCR. The graphs show the expression levels of Vegf-a, Vegf-c, Vegf-d, and Angiopoietin 1 genes in wild-type and Dhx15 silenced conditions. mRNA levels are shown as fold change relative to Hprt mRNA levels. Bars represent mean ± SEM, * p < 0.05 vs. wild-type (n = 4).

Dhx15 genetic deficiency impaired liver regeneration in mice after PHx. (A) On the left graph, hepatic regenerative index (liver weight/total body weight) obtained in WT and Dhx15+/− mice 7 days after PHx. On the right graph, survival curves from WT and Dhx15+/− mice after PHx generated using the product limit method of Kaplan and Meier. Survival curves were compared using the log-rank test. (B) In the upper panels, representative merged images of immunofluorescence staining of Ki67-positive cells (green) and DAPI (blue) in WT and Dhx15+/− livers at 2 (panels a and b) and 3 (panels c and d) days following PHx. In the lower panels (e and f) are representative merged images of immunofluorescence staining of Erg-positive cells (red) and DAPI (blue) in WT and Dhx15+/− livers at 3 days following PHx. Original magnification ×200. The graph shows the computer-assisted quantification of Ki67 and Erg-positive cells/total nuclei at different times following PHx. We differentiated hepatocytes from the rest of the nonparenchymal cells stained positively for Ki67 by the exclusion of smaller nuclear size with the ImageJ software (version 1.53t). Bars represent mean ± SEM, * p < 0.05 vs. wild-type (n = 4). (C) Expression of Pcna and Cyclin d1 proteins was evaluated by Western blot using liver tissue lysates from wild-type and Dhx15+/− mice 3 days after PHx. β-actin was used as a loading control. Densitometric analysis of protein expression is shown on the bar graph. Bars represent mean ± SEM, * p < 0.05 vs. wild-type (n = 3).

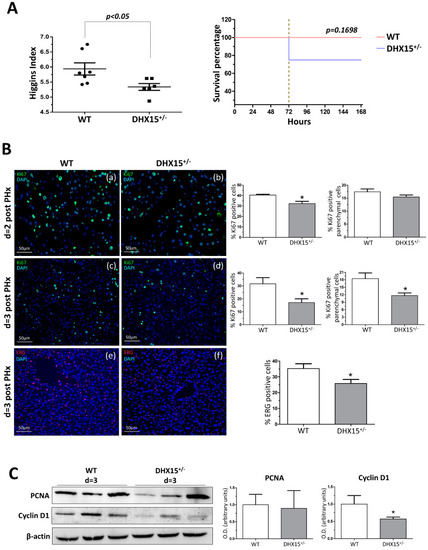
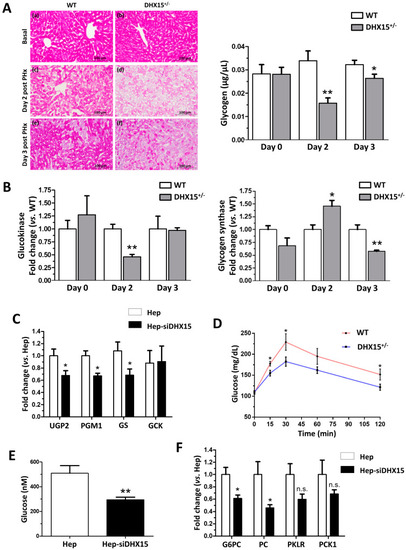
Impaired glucose metabolism in Dhx15+/− mice. (A) On the left, images from periodic acid–Schiff (PAS) staining of wild-type and Dhx15+/− mice in basal condition (upper panels), 2 days after PHx (middle panels) and 3 days after PHx (lower panels). On the right, glycogen in the hepatic tissue of wild-type and Dhx15+/− mice at 0, 2, and 3 days after PHx measured by colorimetric assay. Bars represent mean ± SEM, * p < 0.05 and ** p < 0.01 vs. wild-type at the same time points (n = 6). (B) RNA extraction of liver tissue from either wild-type or Dhx15+/− mice was performed before and 2 and 3 days after PHx. mRNA expression was analyzed by RT-qPCR. The graph shows the expression levels of glucokinase and glycogen synthase genes in the wild-type and Dhx15+/− mice. mRNA levels are shown as fold change relative to Hprt mRNA levels. Bars represent mean ± SEM, * p < 0.05 and ** p < 0.01 vs. wild-type at the same time points (n = 6). (C) RNA extraction of the hepatocyte cell line without or with silenced Dhx15 gene was performed. mRNA expression was analyzed by RT-qPCR. The graph shows the expression levels of Ugp2, Pgm1, Gs, and Gck genes in wild-type and Dhx15 silenced conditions. mRNA levels are shown as fold change relative to Hprt mRNA levels. Bars represent mean ± SEM, * p < 0.05 vs. wild-type (n = 6). (D) Pyruvate tolerance test performed in wild-type and Dhx15+/− mice with an intraperitoneal injection of sodium pyruvate (2.0 g/kg body weight in 1 x PBS) after overnight fasting. Blood glucose levels were measured at 0, 15, 30, 60, and 120 min. Bars represent mean ± SEM, * p < 0.05 vs. wild-type (n = 15). (E) Levels of intracellular glucose production in the hepatocyte cell line without or with silenced Dhx15 gene measured by colorimetric assay. Bars represent mean ± SEM, ** p < 0.01 vs. wild-type (n = 3). (F) RNA extraction of the hepatocyte cell line without or with the Dhx15 gene silenced was performed. mRNA expression was analyzed by RT-qPCR. The graph shows the expression levels of G6pc, Pc, Pklr, and Pck1 genes in the wild-type and Dhx15 silenced conditions. mRNA levels are shown as fold change relative to Hprt mRNA levels. Bars represent the mean ± SEM, * p < 0.05 vs. wild-type (n = 4). N.S. not significant.

Tumor growth and metastases in Dhx15+/− mice following Hepa1-6 tumor induction. (A) In the upper panels, macroscopic images of tumor size in wild-type (panel a) and Dhx15+/− mice (panel b) 5 weeks after mouse Hepa1-6 hepatoma cells implantation. Yellow circles delimitate primary tumor localization. On the lower panels, representative liver sections with metastatic areas after haematoxylin–eosin staining (H&E) in wild-type (panel c) and Dhx15+/− mice (panel d). Original magnification: ×10. The lower images of each condition correspond to the enclosed area of the upper images that were taken at higher magnifications (×100 and ×200, respectively). Quantifications of tumor volume (cm3), number of metastases, and nodule size are shown in the lower graphs. Bars represent mean ± SEM, * p < 0.05 vs. wild-type mice (n = 10 animals for each condition). (B) Immunostaining of intratumoral vessels in wild-type (blood vessels stained with endomucin, panel a, and lymphatic vessels stained with Lyve-1, panel c) and Dhx15+/− (blood vessels stained with endomucin, panel b, and lymphatic vessels stained with Lyve-1, panel d) mice. Quantification of total vascular perimeter and lumen of all intratumoral blood vessels and percentage of Lyve-1-positive immunostaining are shown in the right graphs. Bars represent mean ± SEM, * p < 0.05, ** p < 0.01, *** p < 0.001 vs. wild-type mice (n = 10 animals for each condition). Original magnification: 200×. (C) RNA extraction of primary tumors from either wild-type or Dhx15+/− mice was performed. mRNA expression was analyzed by RT-qPCR. The graph shows the expression levels of Vegf-a, Vegf-d, Vegfr1, Vegfr3, and Angiopoietin 1 genes in wild-type and Dhx15+/− conditions. mRNA levels are shown as fold change relative to Hprt mRNA levels. Bars represent mean ± SEM, * p < 0.05, ** p < 0.01 vs. wild-type (n = 4).

Tumor growth in wild-type mice following Hepa1-6 tumor induction after Dhx15 inhibition. (A) On the left, macroscopic images of tumor size in wild-type AUMscramble ASO (scramble) and AUMsilence ASO (Dhx15 specific)-injected mice 5 weeks after mouse Hepa1-6 hepatoma cells implantation. Yellow circles delimitate primary tumor localization. On the right, the graph shows tumor growth in wild-type AUMsilence ASO (Dhx15-specific) or AUMscramble ASO (scramble)-injected mice. Tumor volume was monitored every 3 days until the end of the study. (B) Immunostaining of intratumoral vessels (blood vessels stained with endomucin, panels a and b, and lymphatic vessels stained with anti-Lyve-1 antibody, panels c and d) in wild-type AUMsilence ASO (Dhx15-specific) or AUMscramble-ASO (scramble)-injected mice. Quantifications of total vascular perimeter and lumen of all intratumoral blood vessels, and percentage of Lyve-1-positive immunostaining are shown in the right graph. Bars represent mean ± SEM, * p < 0.05 vs. wild-type mice (n = 10 animals for each condition). Original magnification: 200×. (C) DHX15 levels in the serum of patients with cirrhosis (n = 35), hepatocellular carcinoma (n = 62), and healthy controls (n = 24).

Acknowledgments
This image is the copyrighted work of the attributed author or publisher, and ZFIN has permission only to display this image to its users. Additional permissions should be obtained from the applicable author or publisher of the image. Full text @ Int. J. Mol. Sci.