IMAGE

Figure 1

ID
ZDB-IMAGE-240415-123
Source
Figures for Portolés et al., 2024
Image
Figure Caption

Figure 1

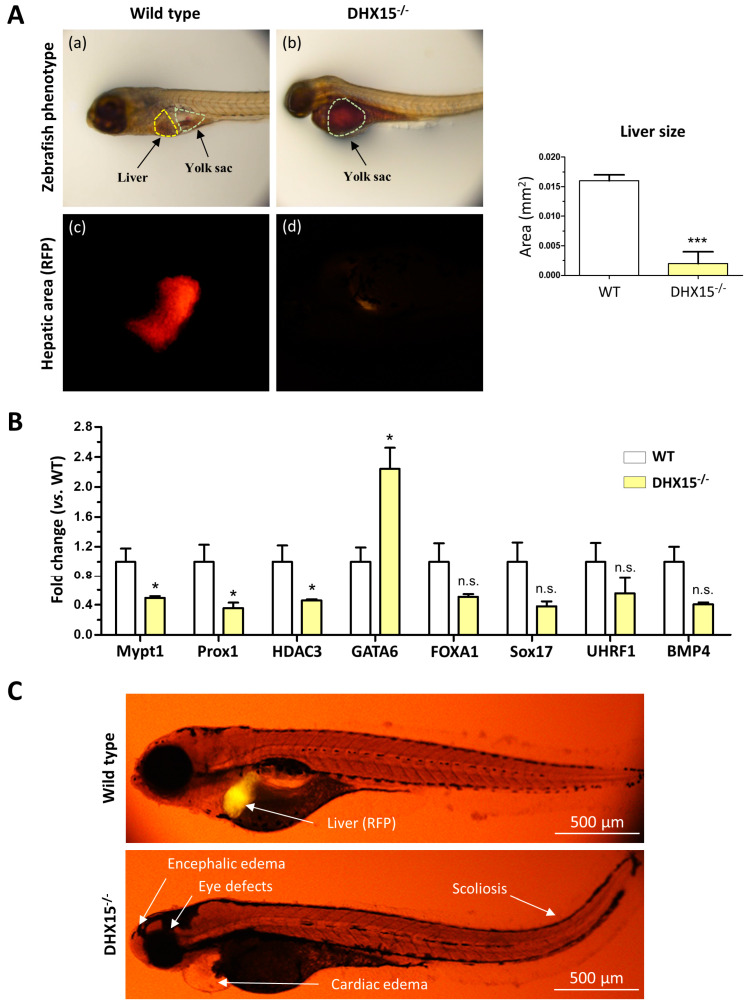
Dhx15 gene deficiency in zebrafish resulted in a liverless phenotype. (A) In the upper panels, representative images of wild-type (panel a) and Dhx15−/− (panel b) larvae at 5 day post fertilization (dpf) revealing an absence of liver development and metabolite retention in the yolk sac. Each area is enclosed with different colors (yellow lines correspond to liver region and green lines to yolk sac). In the lower panels, positive liver red fluorescence in wild-type (panel c) and Dhx15−/− (panel d) larvae. Quantification of liver size is shown in adjacent graph. Bars represent the mean ± SEM, *** p < 0.001 vs. wild-type zebrafish (n = 15). (B) RNA extraction of zebrafish embryos at 4 dpf from either wild-type or Dhx15 knockout larvae was performed. mRNA expression was analyzed by RT-qPCR. The graph shows the expression levels of the Mypt1, Prox1, Hdac3, Gata6, Foxa1, Sox17, Uhrf1, and Bmp4 genes in the Dhx15+/+ and Dhx15−/− conditions. mRNA levels are shown as fold change relative to Actin mRNA levels. Bars represent the mean ± SEM, * p < 0.05 vs. wild-type(n = 4). N.S. not significant. (C) Representative images comparing wild-type and Dhx15−/− larvae at 7 dpf; Dhx15−/− larvae show absence of liver (red fluorescence) and morphological defects including encephalic and cardiac edema, scoliosis, and impaired neural/eye growth.

Acknowledgments
This image is the copyrighted work of the attributed author or publisher, and ZFIN has permission only to display this image to its users. Additional permissions should be obtained from the applicable author or publisher of the image. Full text @ Int. J. Mol. Sci.