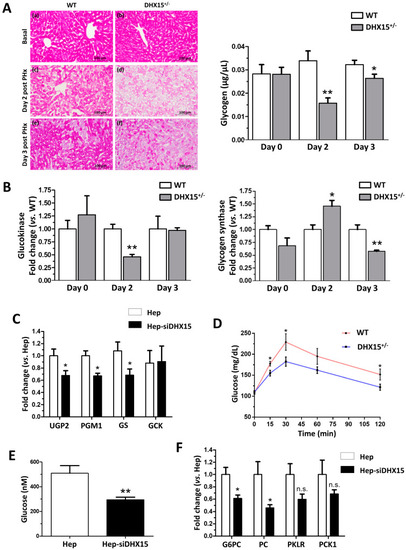
Impaired glucose metabolism in Dhx15+/− mice. (A) On the left, images from periodic acid–Schiff (PAS) staining of wild-type and Dhx15+/− mice in basal condition (upper panels), 2 days after PHx (middle panels) and 3 days after PHx (lower panels). On the right, glycogen in the hepatic tissue of wild-type and Dhx15+/− mice at 0, 2, and 3 days after PHx measured by colorimetric assay. Bars represent mean ± SEM, * p < 0.05 and ** p < 0.01 vs. wild-type at the same time points (n = 6). (B) RNA extraction of liver tissue from either wild-type or Dhx15+/− mice was performed before and 2 and 3 days after PHx. mRNA expression was analyzed by RT-qPCR. The graph shows the expression levels of glucokinase and glycogen synthase genes in the wild-type and Dhx15+/− mice. mRNA levels are shown as fold change relative to Hprt mRNA levels. Bars represent mean ± SEM, * p < 0.05 and ** p < 0.01 vs. wild-type at the same time points (n = 6). (C) RNA extraction of the hepatocyte cell line without or with silenced Dhx15 gene was performed. mRNA expression was analyzed by RT-qPCR. The graph shows the expression levels of Ugp2, Pgm1, Gs, and Gck genes in wild-type and Dhx15 silenced conditions. mRNA levels are shown as fold change relative to Hprt mRNA levels. Bars represent mean ± SEM, * p < 0.05 vs. wild-type (n = 6). (D) Pyruvate tolerance test performed in wild-type and Dhx15+/− mice with an intraperitoneal injection of sodium pyruvate (2.0 g/kg body weight in 1 x PBS) after overnight fasting. Blood glucose levels were measured at 0, 15, 30, 60, and 120 min. Bars represent mean ± SEM, * p < 0.05 vs. wild-type (n = 15). (E) Levels of intracellular glucose production in the hepatocyte cell line without or with silenced Dhx15 gene measured by colorimetric assay. Bars represent mean ± SEM, ** p < 0.01 vs. wild-type (n = 3). (F) RNA extraction of the hepatocyte cell line without or with the Dhx15 gene silenced was performed. mRNA expression was analyzed by RT-qPCR. The graph shows the expression levels of G6pc, Pc, Pklr, and Pck1 genes in the wild-type and Dhx15 silenced conditions. mRNA levels are shown as fold change relative to Hprt mRNA levels. Bars represent the mean ± SEM, * p < 0.05 vs. wild-type (n = 4). N.S. not significant.
|
