FIGURE SUMMARY
Title

Rare genetic variation in fibronectin 1 (FN1) protects against APOEε4 in Alzheimer's disease

Authors
Bhattarai, P., Gunasekaran, T.I., Belloy, M.E., Reyes-Dumeyer, D., Jülich, D., Tayran, H., Yilmaz, E., Flaherty, D., Turgutalp, B., Sukumar, G., Alba, C., McGrath, E.M., Hupalo, D.N., Bacikova, D., Le Guen, Y., Lantigua, R., Medrano, M., Rivera, D., Recio, P., Nuriel, T., Ertekin-Taner, N., Teich, A.F., Dickson, D.W., Holley, S., Greicius, M., Dalgard, C.L., Zody, M., Mayeux, R., Kizil, C., Vardarajan, B.N.
Source
Full text @ Acta Neuropathol.

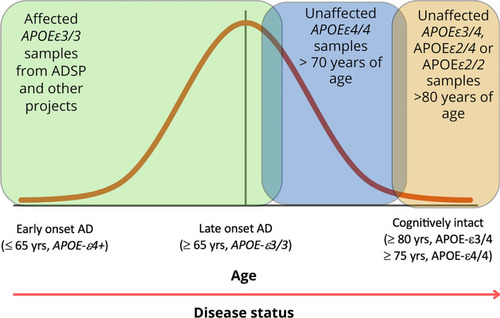
Study design. Comparison of the genomes of elderly APOEε4 carriers with non-carriers

Schematic analytical pipeline for this study

Pathway analysis of variants segregating in APOEε4 carriers

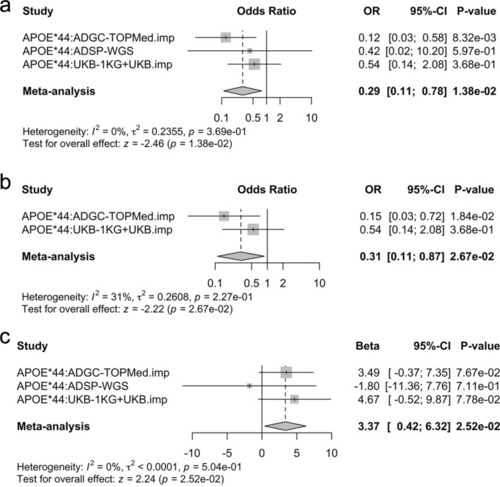
Replication analyses. a Forest plot showing the association of rs140926439 with Alzheimer’s disease risk in APOEε4/4 carriers. Significance was considered at P < 0.05. Results across the datasets were combined using fixed-effects inverse-variance weighted meta-analysis. Cochran’s Q test indicated no significant heterogeneity. OR, odds ratio; CI, confidence interval. b Case–control regression sensitivity analyses for rs140926439 in APOEε4/4 carriers. To ensure an independent replication of discovery findings, in ADGC, samples from NIA-AD FBS cohort were excluded and ADSP whole-genome sequencing data was fully excluded. Results across the datasets were combined using fixed-effects inverse-variance weighted meta-analysis. Cochran’s Q test indicated no significant heterogeneity. c Age at onset analyses for rs140926439 in APOEε4/4 carriers. The large confidence intervals in ADSP whole-genome sequencing (WGS) individuals reflect that there were only two case carriers and one of those had an age at onset at 60 years (an outlier compared to other case carriers). Results across the datasets were combined using fixed-effects inverse-variance weighted meta-analysis. Cochran’s Q test indicated no significant heterogeneity

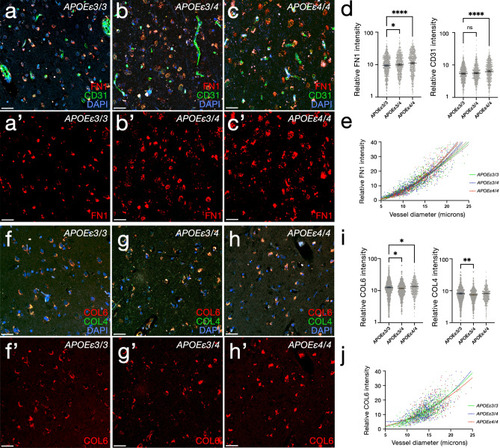
Changes in FN1 and COL6A2 according to APOE genotype. ac′ Double IFS for CD31 (green) and FN1 (red) with DAPI nuclear counterstain in APOEε3/3 (a, a′), APOEε3/4 (b, b′) and APOEε4/4 (c, c′). d FN1 and CD31 intensity comparisons in 2,044 blood vessels from 28 individuals. e Regression model for FN1 intensity with respect to blood vessel diameter in three APOE genotypes. f–h′ Double IFS for COL4 (green) and COL6A2 (red) with DAPI nuclear counterstain in APOEε3/3 (f, f′), APOEε3/4 (g, g′) and APOEε4/4 (h, h′). i COL4 and COL6A2 intensity comparisons in 1,816 blood vessels from 28 individuals. j Regression model for COL6A2 intensity with respect to blood vessel diameter in three APOE genotypes. Scale bars equal 100 μm

FN1 deposition and gliosis reduce to control levels in APOEε4/4 cognitively unaffected individuals, but not in APOEε4/4 AD patients. ac Double IFS for FN1 (green) and GFAP (red) with DAPI nuclear counterstain in APOEε3/3 (a), APOEε4/4 AD (b), and APOEε4/4 cognitively unaffected individuals (c). Black–white images are individual fluorescent channels for FN1, GFAP, and DAPI. df Two blood vessels in every condition are shown in high magnification together with FN1 channel alone. g FN1 intensity comparisons (2 APOEε3/3 individuals without AD, 2 APOEε4/4 individuals with AD, and 6 APOEε4/4 individuals without AD). h GFAP intensity comparisons. Scale bars equal 50 μm (a-c) and 10 μm (d-f)

Fibronectin loss of function affects gliovascular interactions, gliosis, and microglial activity after amyloid toxicity in zebrafish brain. a Feature plots for fibronectin 1a (fn1a) and fibronectin 1b (fn1b) genes in zebrafish brain. b Violin plots in control and Aβ42-treated brains. fn1b is mainly expressed in vascular smooth muscle cells and immune cells and is upregulated with Aβ42. c, d Double IF for astroglia marker glutamine synthase (GS, red) and tight junction marker (ZO-1, green) in wild-type and fn1b−/− animals. Individual fluorescent channels in c′, c′′, d′, and d′′. e, f Individual GS channels. g Quantification for colocalization of ZO-1 and GS. h Comparison of intensity measurements for GS. i, j Double IF for synaptic marker SV2 (green) and microglial marker l-Plastin (red) in wild-type and fn1b−/− animals treated with Aβ42. Individual fluorescent channels in black–white channel. k Quantifications for synaptic density, total number of microglia, and activated microglia. Scale bars equal 25 µm

Schematic abstract for the protective effect of FN1 variants

Acknowledgments
This image is the copyrighted work of the attributed author or publisher, and ZFIN has permission only to display this image to its users. Additional permissions should be obtained from the applicable author or publisher of the image. Full text @ Acta Neuropathol.