FIGURE SUMMARY
Title

Identification of kinase modulators as host-directed therapeutics against intracellular methicillin-resistant Staphylococcus aureus

Authors
van den Biggelaar, R.H.G.A., Walburg, K.V., van den Eeden, S.J.F., van Doorn, C.L.R., Meiler, E., de Ries, A.S., Meijer, A.H., Ottenhoff, T.H.M., Saris, A.
Source
Full text @ Front Cell Infect Microbiol

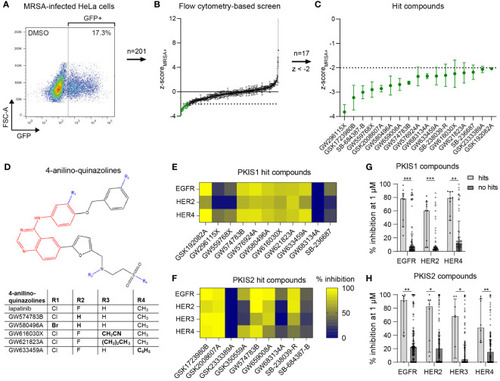
Identification of PKIS compounds inhibiting intracellular growth of MRSA. (A) GFP-positive MRSA-infected HeLa cells were gated to determine the percentage of infected cells. (B) The DMSO control and 201 PKIS compounds were screened to assess their effect on MRSA bacterial burden, expressed as average z-scores of GFP-positive cells (z-scoreMRSA+). (C) The 17 hit compounds with z-scoreMRSA+ < -2 are shown. The screen was performed with three replicates for the PKIS compounds. Error bars represent standard deviations. (D) Structural resemblance of 4-anilino-quinazoline hit compounds with lapatinib. (E, F) The capacity of both PKIS1 (E) and PKIS2 (F) hit compounds to inhibit the HER kinase family is shown. Kinase inhibition data of HER3 were only available for PKIS2 compounds. (G, H) A comparison is made between hit compounds and non-hit PKIS compounds in their capacity to inhibit the human epidermal growth factor receptor (HER) kinase family. Bars and error bars show the median ± interquartile range. Each datapoint represents a PKIS compound. Statistical significance of observed differences was tested using Mann-Whitney tests (*p < 0.05; **p < 0.01; ***p < 0.001).

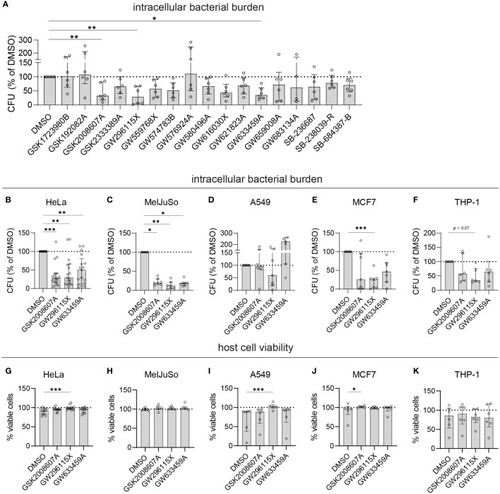
Validation of selected PKIS hit compounds. (A) The efficacy of the PKIS hit compounds against intracellular MRSA was determined by CFU count and given as the percentage of the DMSO control. (B–F) The efficacy of GSK2008607A, GW296115X and GW633459 on the bacterial burden of MRSA-infected HeLa cells (B, n=17), MelJuSo cells (C, n=7), A549 cells (D, n=7), MCF7 cells (E, n=7) and PMA-differentiated THP-1 cells (F, n=6) was determined by CFU count. (G–K) The effect of the compounds on cell viability was assessed using LDH-release assay for HeLa cells (G), MelJuSo cells (H), A549 cells (I), MCF7 cells (J) and PMA-differentiated THP-1 cells (K). Bars and error bars show the median ± interquartile range. Each datapoint represents the results of an independent experiment. Statistical significance of observed differences was tested in comparison to the DMSO controls using Friedman tests (*p < 0.05; **p < 0.01; ***p < 0.001).

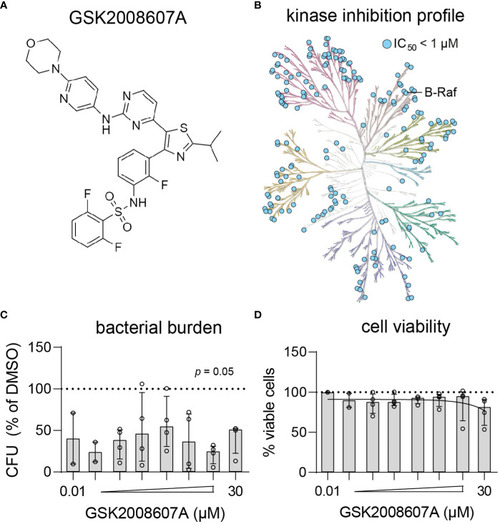
Kinase inhibition profile and potency of GSK2008607A. (A) Chemical structure of GSK2008607A. (B) The KinMap kinase phylogenetic tree shows the kinase inhibition profile of GSK2008607A as determined by KinomeScan (Drewry et al., 2017). Each circle represents a kinase target that is inhibited > 50% at 1 µM concentration. (C, D) GSK2008607A was tested at different concentrations to determine its antimicrobial potency (C) and level of cytotoxicity (D) in MRSA-infected HeLa cells. Bars and error bars show the median ± interquartile range. Each datapoint represents the results of an independent experiment. Statistical significance of observed differences was tested in comparison to the DMSO controls using Friedman tests.

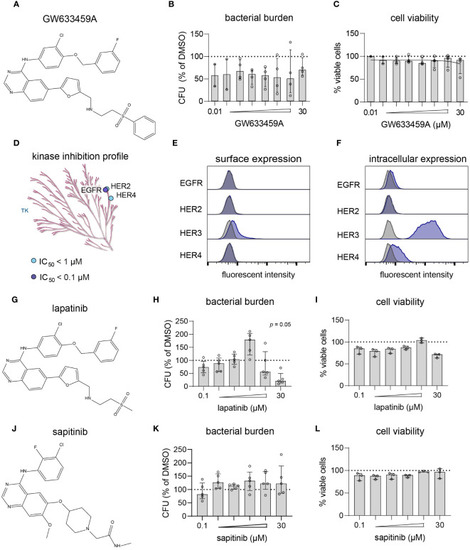
GW633459A is an inhibitor of the HER kinase family and reduces intracellular MRSA burden, but probably through a mechanism unrelated to these host kinase targets. (A) Chemical structure of GW633459A. (B, C) GW633459A was tested at different concentrations to determine its antimicrobial potency (B) and level of cytotoxicity (C) in MRSA-infected HeLa cells. (D) The KinMap kinase phylogenetic tree shows the kinase inhibition profile of GW633459A as determined by Caliper assay (Elkins et al., 2016). Each circle represents a kinase target that is inhibited > 50% at 0.1 µM (purple) or 1 µM (blue) concentration. Only the tyrosine kinase (TK) branch of the phylogenetic tree contains targets of GW633459A. (E, F) Baseline expression of the HER kinase family in HeLa cells was determined by flow cytometry after surface staining (E) or intracellular staining (F). Kinase expression is shown in purple and isotype controls are shows in grey. (G) Chemical structure of lapatinib. (H, I) Lapatinib was tested at different concentrations to determine its antimicrobial potency (H) and level of cytotoxicity (I) in MRSA-infected HeLa cells. (J) Chemical structure of sapitinib. (K, L) Sapitinib was tested at different concentrations to determine its antimicrobial potency (K) and level of cytotoxicity (L) in MRSA-infected HeLa cells. Bars and error bars show the median ± interquartile range. Each datapoint represents the results of an independent experiment. Statistical significance of observed differences was tested in comparison to the DMSO controls using Friedman tests.

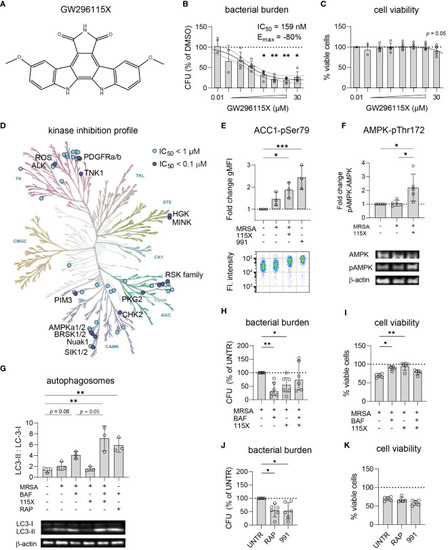
GW296115X activates AMPK resulting in autophagosome formation and elimination of intracellular MRSA. (A) Chemical structure of GW296115X. (B, C) GW296115X was tested at different concentrations to determine its antimicrobial potency (B) and level of cytoxicity (C) in MRSA-infected HeLa cells. (D) The KinMap kinase phylogenetic tree shows the kinase inhibition profile of GW296115X as determined by Caliper assay (Elkins et al., 2016). Each circle represents a kinase target that is inhibited > 50% at 0.1 µM (purple) or 1 µM (blue) concentration. (E) Phosphorylation of ACC1 at Ser80, a direct target of AMPK, was determined by flow cytometry and expressed as fold change in geometric mean fluorescent intensity (gMFI) compared to untreated HeLa cells. The AMPK-activating compound 991 was used as a positive control. (F) Phosphorylation of AMPK at Thr172 was determined by western blot and expressed as the ratio between phosphorylated and unphosphorylated AMPK. (G) Autophagosome formation was determined by western blot and expressed as the ratio between lipidated, membrane-bound LC3 (LC3-II) and cytosolic LC3 (LC3-I). Abbreviations: BAF = bafilomycin A1; RAP = rapamycin. The combination of lysosome inhibitor bafilomycin A1 and mTOR -inhibitor rapamycin results was used as a positive control that results in LC3-II accumulation. (H, I) The interaction between bafilomycin A1 and GW296115X and their effect against intracellular MRSA (H) and host cell viability (I) were determined. (J, K) The effect of two other autophagy-inducing compounds 991 and rapamycin against intracellular MRSA (J) and host cell viability (K) were determined. Each datapoint represents the results of an independent experiment. Statistical significance of observed differences was tested in comparison to the DMSO controls (*p < 0.05; **p < 0.01; ***p < 0.001).

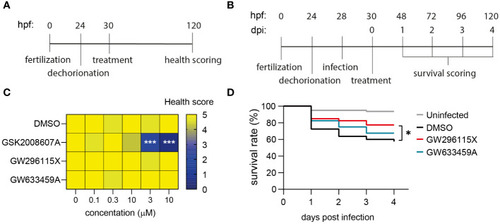
Safety and efficacy of PKIS hit compounds in in vivo zebrafish embryo models. (A) Zebrafish embryos were dechorionated 24 hours post fertilization (hpf), treated with compounds 30 hpf and scored for their health 120 hpf. Health score 5 = healthy embryos; for each of the following symptoms 1 point was subtracted: cranial malformations, oedema, irresponsiveness, tail curve malformations; health score 0 = death embryos. (B) Dechorionated zebrafish embryos were infected at 28hpf with 1000 CFUs MRSA and treated at 30 hpf. The survival of the embryos was assessed daily by checking their heart beat. (C) Dechorionated zebrafish embryos were treated with serial dilutions of DMSO, GSK2008607A, GW296115X, and GW633459A to assess health parameters (n = 15 for each treatment and concentration). (D) Infected zebrafish embryos were treated with 10 µM GW296115X (n = 40), 10 µM GW633459A (n = 40) or 0.1% DMSO as negative solvent control (n = 80). Uninfected controls were included to assess the health state of the embryos at baseline. The data were collected in two independent experiments. Differences between treated and untreated (i.e., DMSO) groups were tested for statistical significance (*p < 0.05, ***p < 0.001).

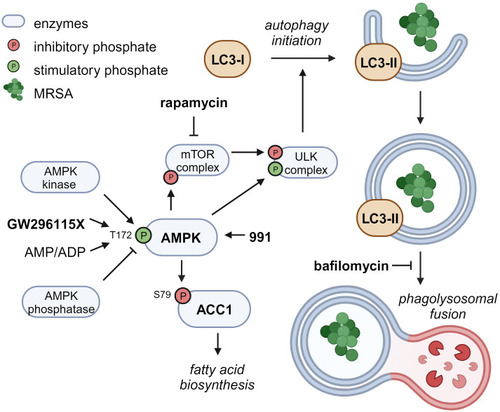
Proposed mechanism of action of compound GW296115X. Compound GW296115X either stimulates AMPK T172 phosphorylation or inhibits its dephosphorylation, resulting in activation of AMPK. Active AMPK phosphorylates ACC1, resulting in decreased fatty acid biosynthesis. In addition, active AMPK phosphorylates the mTOR complex and the ULK complex both directly, thereby inactivating the mTOR complex and activating the ULK complex, which facilitates the initiation of autophagy. The AMPK-activating 991 and mTOR-inhibitor rapamycin show similar effects on ACC1 phosphorylation and autophagy initiation, respectively. Bafilomycin blocks autophagosome degradation, thereby resulting in increased LC3-II levels, especially in combination with drugs that stimulate autophagy initiation including GW296115X or rapamycin. Created with BioRender.com.

Acknowledgments
This image is the copyrighted work of the attributed author or publisher, and ZFIN has permission only to display this image to its users. Additional permissions should be obtained from the applicable author or publisher of the image. Full text @ Front Cell Infect Microbiol