IMAGE

Figure 3

ID
ZDB-IMAGE-240409-5
Source
Figures for van den Biggelaar et al., 2024
Image
Figure Caption

Figure 3

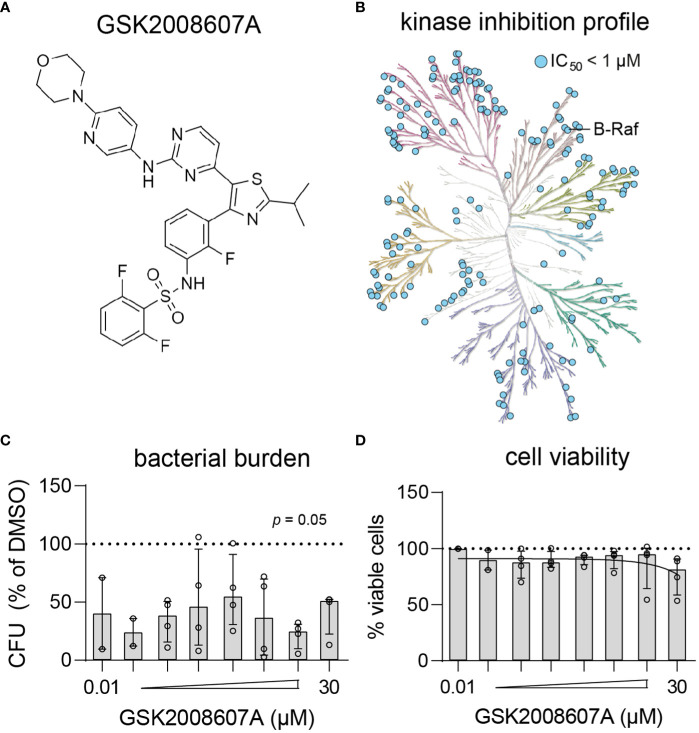
Kinase inhibition profile and potency of GSK2008607A. (A) Chemical structure of GSK2008607A. (B) The KinMap kinase phylogenetic tree shows the kinase inhibition profile of GSK2008607A as determined by KinomeScan (Drewry et al., 2017). Each circle represents a kinase target that is inhibited > 50% at 1 µM concentration. (C, D) GSK2008607A was tested at different concentrations to determine its antimicrobial potency (C) and level of cytotoxicity (D) in MRSA-infected HeLa cells. Bars and error bars show the median ± interquartile range. Each datapoint represents the results of an independent experiment. Statistical significance of observed differences was tested in comparison to the DMSO controls using Friedman tests.

Acknowledgments
This image is the copyrighted work of the attributed author or publisher, and ZFIN has permission only to display this image to its users. Additional permissions should be obtained from the applicable author or publisher of the image. Full text @ Front Cell Infect Microbiol