
- Title
-
Transcription bodies regulate gene expression by sequestering CDK9
- Authors
- Ugolini, M., Kerlin, M.A., Kuznetsova, K., Oda, H., Kimura, H., Vastenhouw, N.L.
- Source
- Full text @ Nat. Cell Biol.
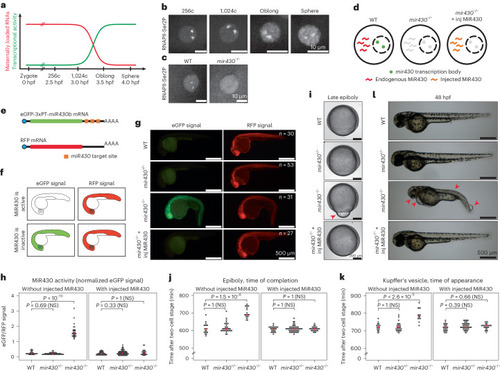
Disruption of |

Disruption of |
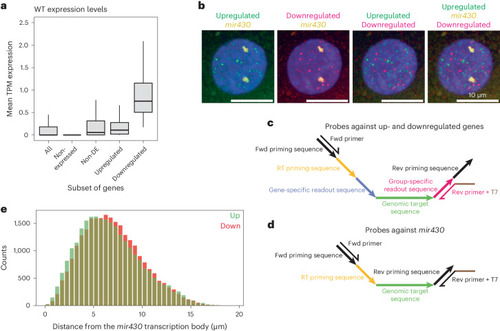
Characterization of downregulated genes. |

Loss of |
Loss of |

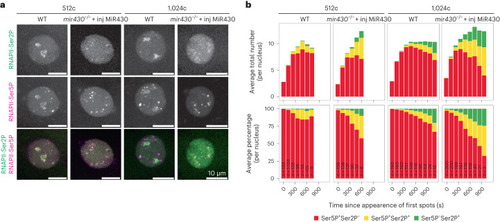
CDK9 sequestration in |