IMAGE

Fig. 2

ID
ZDB-IMAGE-240418-55
Source
Figures for Ugolini et al., 2024
Image
Figure Caption

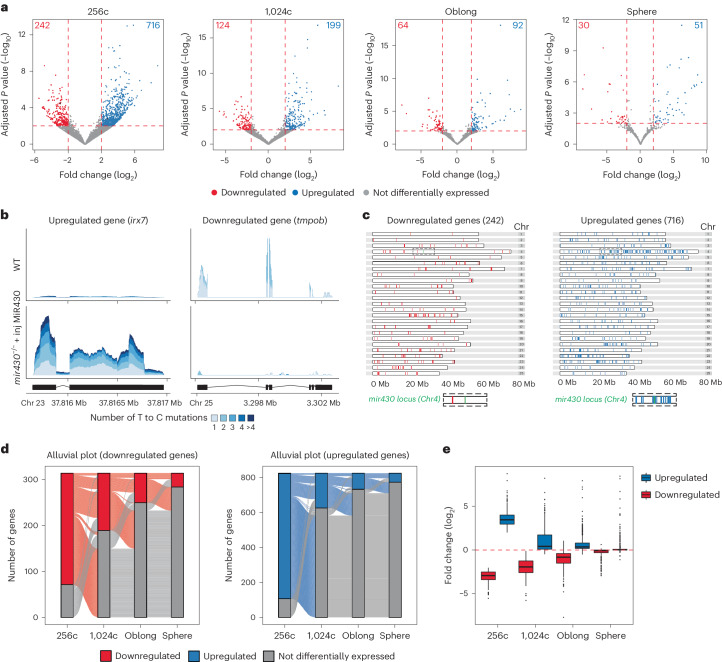
Fig. 2 Disruption of mir430 transcription bodies causes widespread misregulation of gene expression that recovers over time.

a, Volcano plots showing upregulated and downregulated genes in mir430−/− + inj MiR430 (n = 3 biologically independent samples) versus WT (n = 3 biologically independent samples) embryos at 256-cell, 1,024-cell, Oblong and Sphere stages. Wald test with Benjamini–Hochberg correction was performed, and genes with adjusted P values <0.01 were considered significantly differentially expressed. Genes whose coverage is shown in b are shown in black in the left-most plot. b, Coverage plot of irx7 (upregulated) and tmpob (downregulated) in WT and mir430−/− + inj MiR430. The single strata visualize the labelling degree of the reads. c, Distribution of upregulated and downregulated genes across the genome. The mir430 locus on chromosome (Chr) 4 is shown in green and an expansion of its surrounding sequence is shown at the bottom of the panel. d, Alluvial plots showing the overlap between downregulated (left) and upregulated (right) genes at different stages of ZGA. e, Difference in average gene expression between mir430−/− + inj MiR430 and WT embryos across stages for those genes that were identified to be differentially expressed at 256-cell stage (n = 242 downregulated genes and n = 716 upregulated genes). Boxplots show median, quartiles, minimum and maximum, and 1.5× interquartile range. Individual points represent outliers. Source numerical data are available on GEO (GSE248237).

Acknowledgments
This image is the copyrighted work of the attributed author or publisher, and ZFIN has permission only to display this image to its users. Additional permissions should be obtained from the applicable author or publisher of the image. Full text @ Nat. Cell Biol.