|
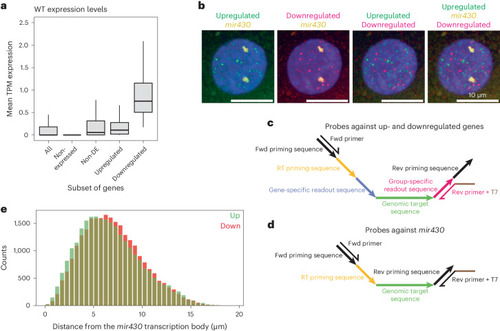
Characterization of downregulated genes. a, Average expression level in transcripts per million (TPM) in WT embryos for all genes (n = 32,428), non-expressed genes (n = 9,545), non-differentially expressed (DE) genes (n = 19,426) and upregulated (n = 716) and downregulated (n = 242) genes (mir430−/− + inj MiR430 versus WT at 256-cell stage). Boxplots show median, quartiles, minimum and maximum, and 1.5× interquartile range. Outliers are not shown. b, Representative images of a DNA-FISH experiment for upregulated genes (green), downregulated genes (magenta) and mir430 (yellow) in a nucleus of a WT embryo at the 256-cell stage. N = 3. Nuclei were also stained with DAPI (blue). Images shown are maximum intensity projections. c,d, Schematic representation of oligopaint probe design for upregulated and downregulated genes (c) and the mir430 locus (d). Primers used for qPCR amplification and their complementarity within a probe are shown. Probe sequences are reported in Supplementary Table 2. Fwd, forward; Rev, reverse. e, Distributions of 3D distances of upregulated (up) genes from the mir430 locus (green) and downregulated (down) genes from the mir430 locus (red) in WT embryos. Quantification of one biological replicate was performed. N = 19 embryos, n = 643 nuclei. Source numerical data are available on GEO (GSE248237).
|