
- Title
-
Parental exposure to antidepressants has lasting effects on offspring? A case study with zebrafish
- Authors
- Correia, D., Bellot, M., Goyenechea, J., Prats, E., Moro, H., Gómez-Canela, C., Bedrossiantz, J., Tagkalidou, N., Ferreira, C.S.S., Raldúa, D., Domingues, I., Faria, M., Oliveira, M.
- Source
- Full text @ Chemosphere
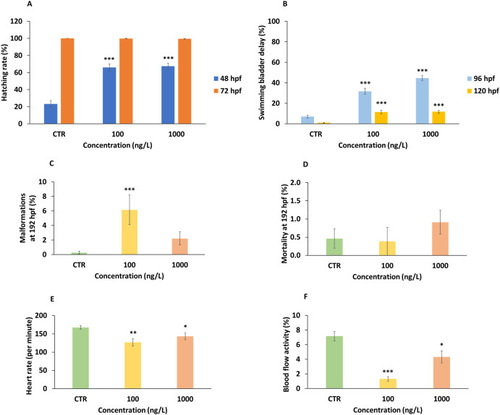
Effects of zebrafish parental exposure to fluoxetine on offspring embryonic development: (A) Hatching rate (%) (n = 540); (B) No inflation of swimming bladder (%) (n = 540); (C) Malformations at 192 hpf (%) (n = 540); (D) Mortality at 192 hpf (%) (n = 540); (E) Heart rate (n = 45); (F) Blood flow activity (%) (n = 45). All data are reported as mean values ± standard error. *p < 0.05, **p < 0.01, ***p < 0.001, compared with the control offspring; One-way ANOVA with Dunnett's multiple comparison test (heart rate) or Kruskal Wallis test with Dunn's multiple comparison test (hatching rate (%), no inflation of swimming bladder (%), malformations (%), mortality (%) and heart flow activity (%)). Data from 3 independent assays. |
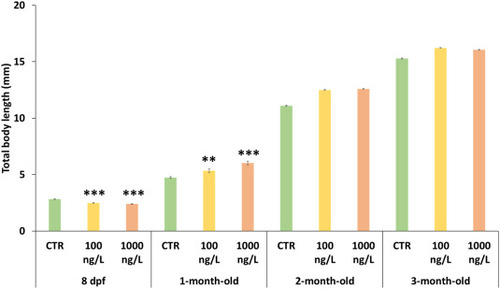
Effects of zebrafish parental exposure to fluoxetine on offspring total body length at different developmental stages, following parental exposure: Total body length at 8 dpf (n = 180), 1 (n = 153), 2- (n = 72) and 3-month-old (n = 108). All data are reported as mean values ± standard error. *p < 0.05, **p < 0.01, ***p < 0.001, compared with the control offspring; One-way ANOVA with Dunnett's multiple comparison test. Data from 3 independent assays. |

Heat map diagram showing the effects of parental exposure to fluoxetine on vibrational startle response (VSR), habituation, basal locomotor activity (BLA), and visual motor response (VMR) of offspring at 8 dpf and 1-month-old. The colors in the heat map represent the deviation from the control offspring (white color), with a gradient of green or red for values below or above the controls, respectively. The number within each cell corresponds to the mean of the results for each parameter normalized as percentage of their respective controls. [8 dpf: (1) VSR, n = 144; (2) Habituation, n = 144; (3) BLA, n = 144; (4) VMR, n = 144 | 1-month-old: (1) VSR, n = 96; (2) Habituation, n = 96; (3) BLA, n = 96; (4) VMR, n = 96]. *p < 0.05, **p < 0.01, ***p < 0.001; [8 dpf: One-way ANOVA with Dunnett's multiple comparison test (VSR) or Kruskal Wallis test with Dunn's multiple comparison test (habituation, BLA and VMR); 1-month-old: Kruskal Wallis test with Dunn's multiple comparison test (VSR, habituation, BLA and VMR)]. Data from 3 independent assays. |

Effects of zebrafish parental exposure to fluoxetine on offspring at 2- and 3-month-old offspring. (A) Table with the changes in the behavioral parameters evaluated in NTT, LDT, SPT and NOT. (B) NTT: Transitions to the top at 2- (n = 24) and 3-month-old offspring (n = 24); (C) Behavioral parameters evaluated in the shoaling test: Average interfish distance (cm) at 2- (n = 24) and 3-month-old offspring; Farthest fish distance at 2- (n = 24) and 3-month-old offspring (n = 24). Data are reported as mean values ± standard error. *p < 0.05, **p < 0.01, ***p < 0.001, compared with the control offspring; [NTT: Kruskal Wallis test with Dunn's multiple comparison test (transitions to top at 2- and 3-month-old offspring); Shoaling test: Kruskal Wallis test with Dunn's multiple comparison test (average interfish distance and farthest fish distance at 2- and 3-month-old offspring)]. Data from 3 independent assays. |

Effects of zebrafish parental exposure to fluoxetine on offspring oxygen consumption at 2- (n = 30) and 3-month-old (n = 30). All data are reported as mean values ± standard error. *p < 0.05, **p < 0.01, ***p < 0.001, compared with the control offspring; Kruskal Wallis test with Dunn's multiple comparison test. Data from 3 independent assays. |

Changes in the expression of six selected monoaminergic genes in the offspring at 8 dpf and 3-month-old, after parental exposure to fluoxetine. |

Heat map diagram showing effects of parental exposure to fluoxetine on monoaminergic neurotransmitters levels of offspring at 8 dpf and 3-month-old. The colors in the heat map represent the deviation from the control offspring, with a gradient of green or red for values below or above the controls, respectively. The number within each cell corresponds to the mean of the results for each parameter normalized as percentage of their respective controls. *p < 0.05, **p < 0.01, ***p < 0.001; [8 dpf: One-way ANOVA with Dunnett's multiple comparison test (5-HT, tryptophan, dopamine, HVA and norepinephrine) or Kruskal Wallis test with Dunn's multiple comparison test (tyrosine); 3-month-old: One-way ANOVA with Dunnett's multiple comparison test (5-HT, tryptophan, dopamine, HVA, tyrosine and norepinephrine)]. Data from 3 independent assays. |
|