
|
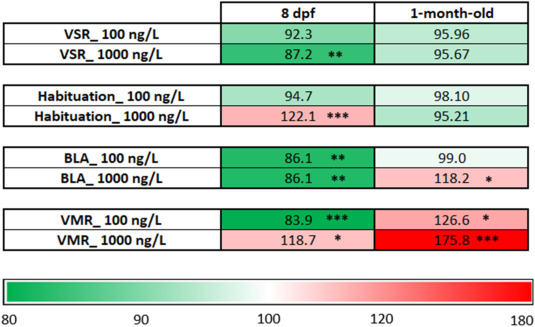
Fig. 3 Heat map diagram showing the effects of parental exposure to fluoxetine on vibrational startle response (VSR), habituation, basal locomotor activity (BLA), and visual motor response (VMR) of offspring at 8 dpf and 1-month-old. The colors in the heat map represent the deviation from the control offspring (white color), with a gradient of green or red for values below or above the controls, respectively. The number within each cell corresponds to the mean of the results for each parameter normalized as percentage of their respective controls. [8 dpf: (1) VSR, n = 144; (2) Habituation, n = 144; (3) BLA, n = 144; (4) VMR, n = 144 | 1-month-old: (1) VSR, n = 96; (2) Habituation, n = 96; (3) BLA, n = 96; (4) VMR, n = 96]. *p < 0.05, **p < 0.01, ***p < 0.001; [8 dpf: One-way ANOVA with Dunnett's multiple comparison test (VSR) or Kruskal Wallis test with Dunn's multiple comparison test (habituation, BLA and VMR); 1-month-old: Kruskal Wallis test with Dunn's multiple comparison test (VSR, habituation, BLA and VMR)]. Data from 3 independent assays.