
- Title
-
Infection induced inflammation impairs wound healing through IL-1β signaling
- Authors
- Shen, S., Miskolci, V., Dewey, C.N., Sauer, J.D., Huttenlocher, A.
- Source
- Full text @ iScience

Inflammation stimulated by inflammasome signaling impairs wound healing in Lm-infected zebrafish larvae (A) Lm-Pyro hyperactivates the inflammasome through secretion of flagellin. (B) Representative merged images of single-plane brightfield and fluorescent images of the caudal fin of zebrafish larvae in response to WT Lm or Lm-Pyro infection over time using mCherry-expressing Lm, and the corresponding quantification of tissue regrowth from three biological replicates are shown in (C). White dashed line in (B) outlines regrowth area. N = 28–32 larvae per treatment per time point. (D) CFU of Lm was determined at indicated timepoints by pooling 10 zebrafish larvae per condition per time point. (E) Representative sum-projections of z stacks of the caudal fin acquired by laser scanning confocal microscope using Tg(NF-κB:EGFP) larvae and mCherry-expressing Lm fixed at indicated time points. NF-κB is shown in green and Lm is shown in magenta. White dashed line denotes the wound sites, where NF-κB was quantified. The corresponding quantification of Lm fluorescent area at the tail fins quantified by area thresholding is shown in (F) and NF-κB index showing NF-κB integrated intensity normalized to regrowth area is plotted in (G). (E–G) N = 24–33 larvae per treatment per time point. (H) Representative sum-projections of z stacks acquired by laser scanning confocal microscope using double transgenic larvae (Tg(tnfa:GFP) x Tg(mpeg1:mCherry-CAAX)) over time in response to uninfected, WT Lm-infected, or Lm-Pyro-infected wounds. TNFα is shown in cyan and macrophages are shown in magenta. White dashed line denotes area measured for TNFα+ macrophages area. Corresponding quantification is plotted in (I) with TNFα index showing percentage of TNFα positive macrophages quantified by area thresholding and normalized by regrowth fin area. (H and I) N = 25–32 larvae per treatment per time point. Values in (C), (D), (F), (G), and (I) are arithmetic means and SE with associated p values obtained by least square mean analysis in (C), two-way ANOVA in (D), and rank analysis due to residuals not being normally distributed in (F), (G), and (I). Three biological replicates were performed with data points from different biological replicates displayed in different shades of gray. ∗p < 0.05, ∗∗p < 0.01, ∗∗∗p < 0.001, ∗∗∗∗p < 0.0001. See also Figure S1. |
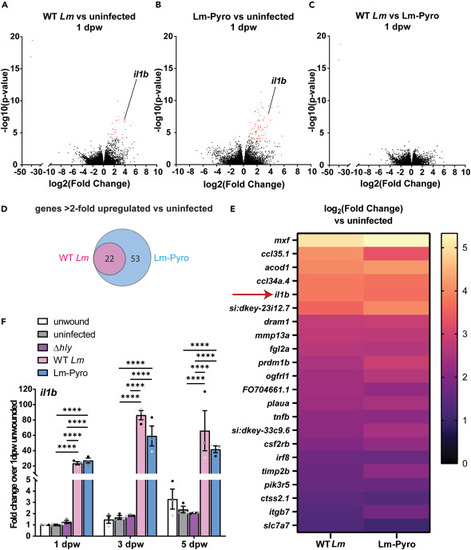
Transcriptomic analysis identifies il1b as an inflammatory marker in Lm-infected wounds (A) Volcano plot for gene expression comparison between (A) uninfected and WT Lm-infected, (B) uninfected and Lm-Pyro infected, and (C) WT Lm-infected and Lm-Pyro-infected tail fins at 1 dpw obtained by RNA sequencing. (A–C) Red dots depict more than 2-fold upregulated genes and blue dots depict more than 2-fold downregulated genes for with Benjamini-Hochberg corrected p value < 0.05 for each comparison. (D) Venn diagram depicting genes that are more than 2-fold upregulated compared to uninfected condition in WT Lm-infected and Lm-Pyro-infected tail wounds, with the overlapping gene lists shown in a heatmap in (E). (A–E) n = 50 per treatment per biological replicate with three biological replicates. (F) il1b expression normalized to fold change over 1 dpw unwounded condition in pooled tail fin tissue collected from larvae from each treatment at indicated time points measured by RT-qPCR from three biological replicates with n = 18–25 larvae per treatment per time point per biological replicate. (F) is showing arithmetic means and SE with associated p values obtained by two-way ANOVA performed on RT-qPCR ΔCq values. Data points from different biological replicates are displayed in different shades of gray. ∗∗∗∗p < 0.0001. See Table S1 for detailed information on upregulated genes shown in (E). |

Lm inhibits wound healing through IL-1β signaling (A) Representative images for sum-projections of z stacks acquired by laser scanning confocal microscope using std MO- or il1b MO-injected Tg(NF-κB:EGFP) zebrafish larvae and mCherry-expressing Lm fixed at 3 dpw. NF-κB signal is shown in green and Lm shown in magenta. Scale bar is 100 microns. (B) PCR amplification of il1b cDNA from std MO- or il1b MO-injected larvae at 3 dpw. Quantification of (C) Lm fluorescent area at the tail fins using area thresholding, (D) regrowth area of the tail fins and (E) integrated intensity for background-corrected NF-κB normalized to regrowth area shown as NF-κB index from images in (A) from three biological replicates with n = 28−36. (F and G) 1 day-post-fertilization larvae were treated with 10 μM anakinra with quantification of regrowth area over time in (F). (G) CFU of Lm was determined at indicated timepoints by pooling 10 larvae per condition per time point from three biological replicates. (F) Regrowth area was quantified from three biological replicates with N = 28–36 larvae per treatment per time point. (C–G) are arithmetic means and SE with associated p values obtained by least square mean analysis in (C), rank analysis due to residuals not being normally distributed in (D–F), and two-way ANOVA in (G). Data points from different biological replicates are displayed in different shades of gray. ∗p < 0.05, ∗∗p < 0.01, ∗∗∗p < 0.001, ∗∗∗∗p < 0.0001. See also Figure S2. |

Early eradication of Lm infection is required for inflammation resolution and wound healing (A) Experimental setup is shown. Double transgenic WT larvae (Tg(tnfa:GFP) x Tg(mpeg1:mCherry-CAAX)) fixed and imaged at indicated timepoints (5–7 dpw) following uninfected, WT Lm-infected, or WT Lm-infected tail transection at 3 dpf that were treated with ampicillin starting at 1, 2, or 3 dpw. (B) CFU of Lm at 5 dpw was determined by pooling 10 zebrafish larvae per condition per time point from four biological replicates. (C) Representative sum-projections of z stack images at 7 dpw acquired by laser scanning confocal microscope are shown. Tail wounds were also imaged at 5 and 6 dpw, but only the 7 dpw time point is shown. White dashed line on top row outlines regrowth area and on bottom row denotes area for TNFα+ macrophage quantification. TNFα is shown in cyan and macrophages are shown in magenta. Scale bar is 100 microns. (D) Corresponding quantification of regrowth area of larvae at 5, 6, and 7 dpw using dataset in (C), and in (E) corresponding quantification of TNFα index showing TNFα+ macrophages were quantified by area thresholding and normalized to regrowth area. (C–E) from three biological replicates with total N = 27–34 larvae per treatment per time point. (B), (D), and (E) are arithmetic means and SE with associated p values obtained by two-way ANOVA in (B) and rank analysis in (D) and (E). Data points from different biological replicates are displayed in different shades of gray. ∗∗p < 0.01, ∗∗∗∗p < 0.0001. Amp, ampicillin; un., uninfected; un. 1 day, uninfected Amp at 1 dpw; Lm 1 day, Lm-infected Amp at 1 dpw; Lm 2 days, Lm-infected Amp at 2 dpw; Lm 3 days, Lm-infected Amp at 3 dpw. |