
|
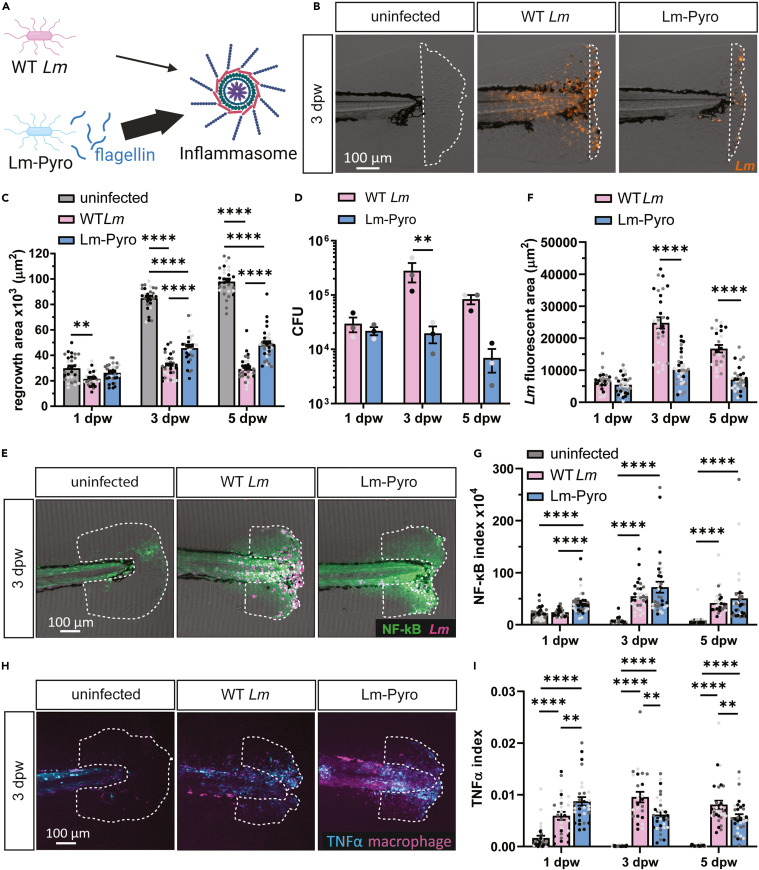
Fig. 1 Inflammation stimulated by inflammasome signaling impairs wound healing in Lm-infected zebrafish larvae (A) Lm-Pyro hyperactivates the inflammasome through secretion of flagellin. (B) Representative merged images of single-plane brightfield and fluorescent images of the caudal fin of zebrafish larvae in response to WT Lm or Lm-Pyro infection over time using mCherry-expressing Lm, and the corresponding quantification of tissue regrowth from three biological replicates are shown in (C). White dashed line in (B) outlines regrowth area. N = 28–32 larvae per treatment per time point. (D) CFU of Lm was determined at indicated timepoints by pooling 10 zebrafish larvae per condition per time point. (E) Representative sum-projections of z stacks of the caudal fin acquired by laser scanning confocal microscope using Tg(NF-κB:EGFP) larvae and mCherry-expressing Lm fixed at indicated time points. NF-κB is shown in green and Lm is shown in magenta. White dashed line denotes the wound sites, where NF-κB was quantified. The corresponding quantification of Lm fluorescent area at the tail fins quantified by area thresholding is shown in (F) and NF-κB index showing NF-κB integrated intensity normalized to regrowth area is plotted in (G). (E–G) N = 24–33 larvae per treatment per time point. (H) Representative sum-projections of z stacks acquired by laser scanning confocal microscope using double transgenic larvae (Tg(tnfa:GFP) x Tg(mpeg1:mCherry-CAAX)) over time in response to uninfected, WT Lm-infected, or Lm-Pyro-infected wounds. TNFα is shown in cyan and macrophages are shown in magenta. White dashed line denotes area measured for TNFα+ macrophages area. Corresponding quantification is plotted in (I) with TNFα index showing percentage of TNFα positive macrophages quantified by area thresholding and normalized by regrowth fin area. (H and I) N = 25–32 larvae per treatment per time point. Values in (C), (D), (F), (G), and (I) are arithmetic means and SE with associated p values obtained by least square mean analysis in (C), two-way ANOVA in (D), and rank analysis due to residuals not being normally distributed in (F), (G), and (I). Three biological replicates were performed with data points from different biological replicates displayed in different shades of gray. ∗p < 0.05, ∗∗p < 0.01, ∗∗∗p < 0.001, ∗∗∗∗p < 0.0001. See also Figure S1.