
|
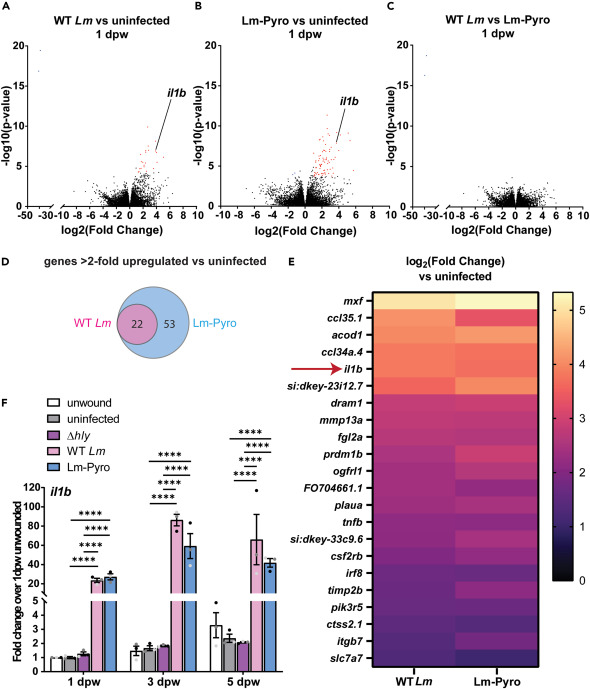
Fig. 2 Transcriptomic analysis identifies il1b as an inflammatory marker in Lm-infected wounds (A) Volcano plot for gene expression comparison between (A) uninfected and WT Lm-infected, (B) uninfected and Lm-Pyro infected, and (C) WT Lm-infected and Lm-Pyro-infected tail fins at 1 dpw obtained by RNA sequencing. (A–C) Red dots depict more than 2-fold upregulated genes and blue dots depict more than 2-fold downregulated genes for with Benjamini-Hochberg corrected p value < 0.05 for each comparison. (D) Venn diagram depicting genes that are more than 2-fold upregulated compared to uninfected condition in WT Lm-infected and Lm-Pyro-infected tail wounds, with the overlapping gene lists shown in a heatmap in (E). (A–E) n = 50 per treatment per biological replicate with three biological replicates. (F) il1b expression normalized to fold change over 1 dpw unwounded condition in pooled tail fin tissue collected from larvae from each treatment at indicated time points measured by RT-qPCR from three biological replicates with n = 18–25 larvae per treatment per time point per biological replicate. (F) is showing arithmetic means and SE with associated p values obtained by two-way ANOVA performed on RT-qPCR ΔCq values. Data points from different biological replicates are displayed in different shades of gray. ∗∗∗∗p < 0.0001. See Table S1 for detailed information on upregulated genes shown in (E).