FIGURE SUMMARY
Title

Forward genetic screen using a gene-breaking trap approach identifies a novel role of grin2bb-associated RNA transcript (grin2bbART) in zebrafish heart function

Authors
Angom, R.S., Joshi, A., Patowary, A., Sivadas, A., Ramasamy, S., K V, S., Kaushik, K., Sabharwal, A., Lalwani, M.K., K, S., Singh, N., Scaria, V., Sivasubbu, S.
Source
Full text @ Front Cell Dev Biol

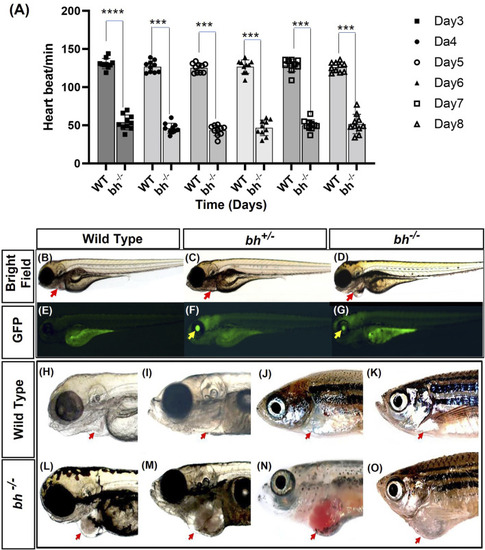
Heartbeat rate analysis and phenotypic characterization of bigheart mutant. (A) Heartbeat rate analysis in wild type (bh+/+) and bigheart mutant fish (bh−/−) fish. X-axis represents time in days, and Y-axis represents heartbeat per minute. (B–O) Phenotypic characterization of bigheart mutant. (B–D) represent bright field images of 3 dpf wild type (WT) embryos, heterozygous embryos (bh+/−), and bigheart homozygous (bh−/−) mutant embryos, respectively. (E–G) represent respective fluorescence images at 3 dpf. (Images were captured at ×2.5). Yellow arrowheads indicate GFP expression in the eye and red arrowheads indicate location of the heart. (H,J,L,N) represent WT fish at 3 dpf, 15 dpf, 90 dpf and 9 months. (I,K,M,O) represent corresponding images of the bh−/− fish at 3 dpf, 15 dpf, 90 dpf, and 9 months, respectively (***, p < 0.001, ****, p < 0.0001). The bars indicate the average values ± SD.

The electrocardiogram profile of
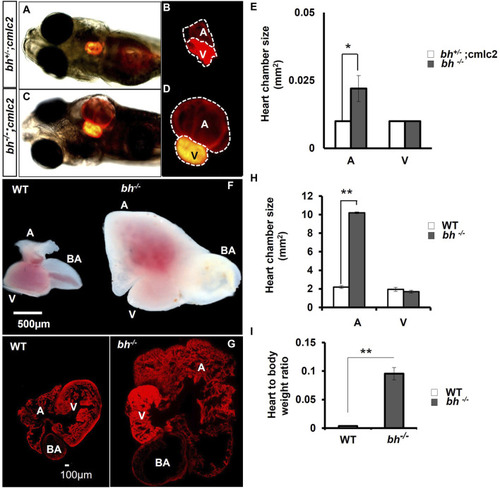
 bigheart fish indicates signs of arrhythmia. (A) Electrocardiogram recordings of wild-type (bh+/+) zebrafish. X-axis represents time in milliseconds (ms), and Y-axis represents voltage in millivolts (mV). (B) Electrocardiogram recording of bh−/− fish, red arrowhead represents the absence of beats. (C) Graph representing the R-R interval in wild type and bh−/− fish. (D) Graph representing heart beat rate in adult wild type (bh+/+) zebrafish and bh−/− fish. (E) Graph showing an overlay of wild type and bh−/− mutant ECG recordings (Regular line and dashed line represents the ECG profiles of wild type and bh−/− fish, respectively). P, Q, R, S and T represent regular ECG waves. (**, p < 0.01). The bars indicate the average values ± SD.

Anatomical study of bh−/−;myl7: RFP double transgenic reveals atrial enlargement in bigheart. (A,B) 5dpf double transgenic (bh+/−; myl7) fish embryo with red fluorescence protein expression in the normal heterozygous siblings heart (bh+/−). (C,D)Bigheart mutant (bh−/−; myl7) embryo with red fluorescence protein expression in the heart. (B,D) Zoomed images of the heart in transgenic, bh+/+; myl7 and bh−/−; myl7 embryos (Images were captured at ×5 magnification using Zeiss Axio-observer 40 microscope). (E) Heart chamber size measurement in wild type and mutant embryos; the X-axis represents heart chambers (A: atrium; V: ventricle, BA: bulbus arteriosus); Y-axis represents the heart chamber size in mm2. (F) Dissected wildtype and mutant (bh−/−) 9 months old adult heart. (G) Heart tissue section of wild type and mutant (bh−/−) stained with phalloidin texas red showing enlarged atrium and dilated bulbus arteriosus. (H) Graph representing the heart chamber size in WT and bh−/− fish corresponding to (F). (I) Heart to body weight ratios for WT and bh−/− mutant fish indicating enlarged heart of the mutant as compared to WT. (A: atrium; V: ventricle; BA: bulbus arteriosus). (Images were captured at ×2.5) (and **, p < 0.01). The bar indicates the average values ± SD.

grin2bb transcript and protein levels are unaffected in bigheart. (A) pGBT-PX integration in bigheart maps to intron 2 of grin2bb gene located on the reverse strand of Chromosome 1. Box in red indicates the 5′RACE mapped region, blue represents the 3′ RACE mapped region, and the green represents the iPCR mapped region. (B) Screen shot of UCSC genome bowser showing the grin2bb transcript and the bigheart GBT insertion loci in the intron 2. (C) Expression profiling of grin2bb transcript in 9-month-old adult WT heart tissue using in situ hybridization. (D) qRT PCR showing relative expression of grin2bb partial transcript in sibling wildtype and bh−/− heart tissue. (E) Western blot analysis of grin2bb in WT and bh−/− heart tissue. β-actin was used as internal control. (F) Quantification showing Grin2bb protein fold change in the WT and bh−/−. (black arrows in A indicate the regions where the primers were designed. The RT PCR and western blot experiments were repeated three times. The bar indicates the average values ± SD.

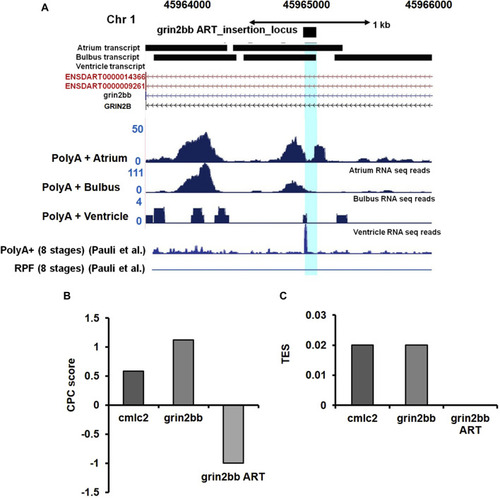
Ultra-deep RNA sequencing of WT heart suggests the presence of unannotated transcript in iPCR mapped region. (A) Snapshot displaying the grin2bbART locus across the three cardiac chambers in zebrafish. RNA sequencing and ribosomal profiling reads have been aligned and mapped onto the grin2bbART locus. (B) Graph representing coding potential score of grin2bbART as well as grin2bb and myl7 transcripts. (C) Translation efficiency score (TES) score of grin2bbART, grin2bb, and myl7 transcripts.

Cre-recombinase restores wild type expression of grin2bbART in bigheart mutant. (A)Expression profiling of grin2bbART transcript in adult zebrafish using whole mount in situ hybridization(B)grin2bbART expression in bh−/− heart tissue (A: atrium; V: ventricle; BA: bulbus arteriosus) (C) qRT PCR analysis showing the relative expression of grin2bbART in WT and bh−/− heart tissues. (D) Schematic depicting Cre-recombinase mediated gene trap reversion in bigheart mutant. Triangles in pink represent the loxP sites flanking the gene trap. By supplying Cre recombinase mRNA, the mutagenicity cassettes and 3′ exon trap are excised. (E)Cre recombinase reverts the bigheart phenotype to wild type, approximately in 50% of the injected embryos, compared to non-injected control. (F) Relative expression of grin2bbART in Cre recombinase injected WT and bh−/− embryos. Black arrowhead shows positions of primers of the PCR analysis of Cre recombinase injected and non-injected bh−/− embryos. N = 5 heart samples were analyzed in each group for the in-situ experiment. The RT-PCR experiments were repeated three times in triplicate reactions. (**, p < 0.01). The bars indicate the average values ± SD.

Whole mount in situ hybridization of grin2bbART mRNA in zebrafish embryos. (A–C) Representative embryos showing the expression of grin2bbART mRNA probe at (A) 12 hpf, (B) 18 hpf, (C) 22 hpf dorsal view and (C′). 22 hpf ventral view. (D,F,H) grin2bbART sense probe showing the absence of grin2bbART signal at 24 hpf, 36 hpf. (E) Dorsal view of 24 hpf showing grin2bbART mRNA expression in the CNS. (E′) enlarged image showing the region in red dotted box in (E). (G) Dorsal view of 36 hpf embryo showing grin2bbARTexpression in the CNS, somites and myotomes. (G′) enlarged image showing the region in red dotted box in (G). (I,I′) grin2bbART expression in the somites. I′ shows the enlarged view of red box in (I). (J) Lateral view of the 48 hpf embryos anterior region probed with the sense riboprobe showing the absence of grin2bbART expression. (K) Lateral view showing grin2bbART expression in the brain and heart of 2 dpf embryo. K′ shows expression in the CNS. (L) Ventral view of the anterion head region of 48 hpf embryo showing grin2bbART expression in the heart. fb, forebrain; mb, mid brain; hb, hind brain; mhb, mid brain hin brain boundary; h, heart; V, ventricle; a; atrium; CNS, Central Nervous system. The experiment was repeated atleast two times and n = 10 animals were analyzed per time points.

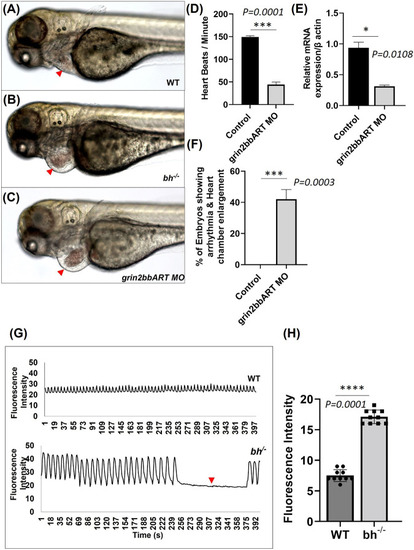
Big heart mutants displayed calcium mishandling and morpholino based knockdown of grin2bbART phenocopies the cardiac phenotype of bigheart.(A) Wild type zebrafish embryo at 3 dpf, (B)bigheart mutant at 3 dpf, (C)grin2bbART morphant at 3 dpf. (D) Graph representing heartbeat rate in the grin2bbART MO injected embryos. NIC, Non-injected control. Red arrowheads mark the heart. (Images were captured at ×5 magnification). (E) Ralative mRNA expression of grin2bbART after MO mediated grin2bbART knockdown. (F) Graph representing the percentage of embryos showing arrhythmia and chamber enlargement in the grin2bbART MO injected embryos. (G) Graph showing calcium signals in wildtype and bh−/− age-matched zebrafish. X-axis represents time in seconds. The Y-axis represents fluorescence intensity. The arrow highlights the signals that indicate the absence of calcium signal and heartbeat in bh−/− compared to WT. (H) Graph showing the fluorescence intensity in WT and bh−/− (N = 10 zebrafish were studied for heart analysis in each group). For calcium imaging N = 10, 2 dpf zebrafish embryos were analyzed. **, p < 0.01, ***, p < 0.001 and ****, p < 0.0001. The realtime RT PCR experiment was repeated atleast two time. The bars indicates the average values ± SD.

Transcriptome analysis of bigheart mutant. (A) MA-plot for differential expression analysis in RNA-seq of bh+/− and bh−/−, x axis indicates the normalized mean expression (Log2 mean expression) and the y axis indicates the log 2 fold change (Red dots: upregulated genes and the blue dots: downregulated genes) (Log2 normal count). (B) Heat map showing differential expression of selected cardiac genes in bh+/− and bh−/− heart tissue (Log2 normal count). (C) Western blot analysis of calcium handling gene, Camk2d1 and cardiac remodeling gene, Hdac1 in adult heart tissue. (D) Quantification of Western blot in (C). (E) mRNA expression of calcium handling genes ryr2b and atp2a2a in bh+/− and bh−/− heart. RT PCR analyses were performed three times in triplicates. **p < 0.01 and ***p < 0.001. The bars indicate the average values ± SD.

Acknowledgments
This image is the copyrighted work of the attributed author or publisher, and ZFIN has permission only to display this image to its users. Additional permissions should be obtained from the applicable author or publisher of the image. Full text @ Front Cell Dev Biol