IMAGE

FIGURE 8

ID
ZDB-IMAGE-240327-12
Source
Figures for Angom et al., 2024
Image
Figure Caption

FIGURE 8

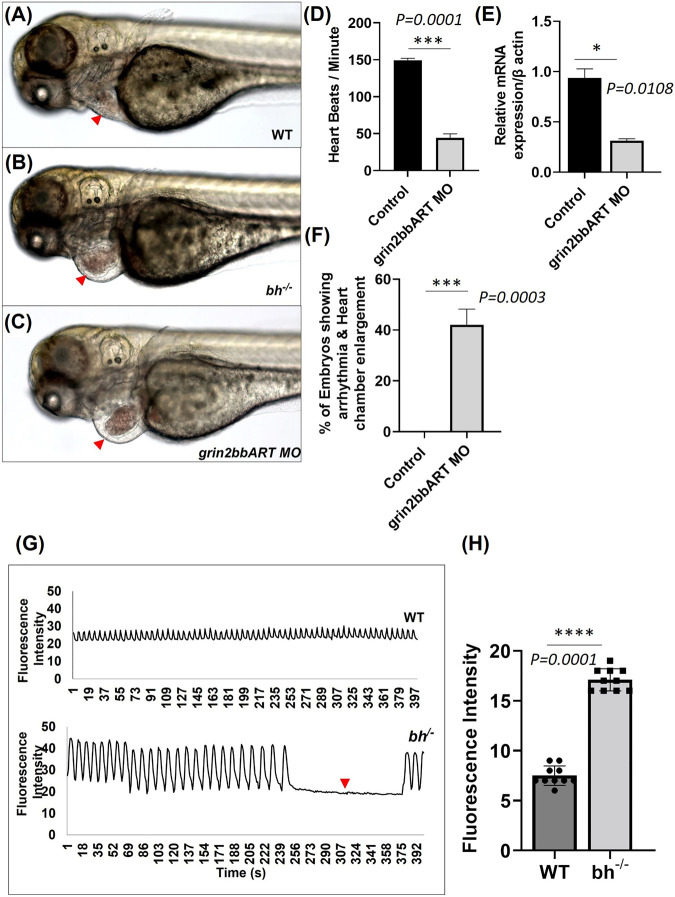
Big heart mutants displayed calcium mishandling and morpholino based knockdown of grin2bbART phenocopies the cardiac phenotype of bigheart.(A) Wild type zebrafish embryo at 3 dpf, (B)bigheart mutant at 3 dpf, (C)grin2bbART morphant at 3 dpf. (D) Graph representing heartbeat rate in the grin2bbART MO injected embryos. NIC, Non-injected control. Red arrowheads mark the heart. (Images were captured at ×5 magnification). (E) Ralative mRNA expression of grin2bbART after MO mediated grin2bbART knockdown. (F) Graph representing the percentage of embryos showing arrhythmia and chamber enlargement in the grin2bbART MO injected embryos. (G) Graph showing calcium signals in wildtype and bh−/− age-matched zebrafish. X-axis represents time in seconds. The Y-axis represents fluorescence intensity. The arrow highlights the signals that indicate the absence of calcium signal and heartbeat in bh−/− compared to WT. (H) Graph showing the fluorescence intensity in WT and bh−/− (N = 10 zebrafish were studied for heart analysis in each group). For calcium imaging N = 10, 2 dpf zebrafish embryos were analyzed. **, p < 0.01, ***, p < 0.001 and ****, p < 0.0001. The realtime RT PCR experiment was repeated atleast two time. The bars indicates the average values ± SD.

Acknowledgments
This image is the copyrighted work of the attributed author or publisher, and ZFIN has permission only to display this image to its users. Additional permissions should be obtained from the applicable author or publisher of the image. Full text @ Front Cell Dev Biol