FIGURE SUMMARY
Title

Zebrafish CCNF and FUS Mediate Stress-Specific Motor Responses

Authors
Aksoy, Y.A., Cole, A.J., Deng, W., Hesselson, D.
Source
Full text @ Cells

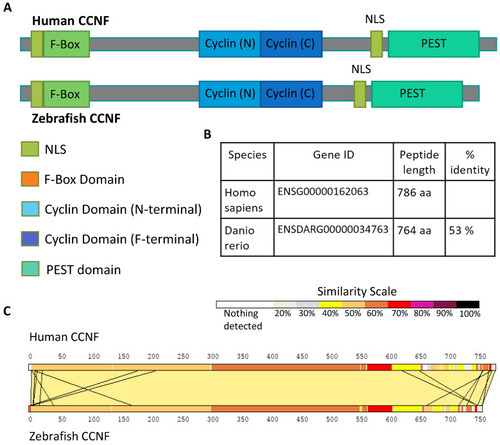
Schematic overview of CCNF protein. (A) Graphical alignment of the functional domains in human and zebrafish CCNF proteins. (B) Conservation of full-length human and zebrafish CCNF proteins. (C) A pair-wise comparison of the sequence similarity of human CCNF and zebrafish Ccnf, displayed by LalnView [23].

Generating ccnf-deficient zebrafish lines. (A) Design of sgRNA targeting the PEST region of ccnf. (B) +14bp insertion at the CRISPR/Cas9 target site resulting with premature stop codon (C) High resolution melting analysis (HRMA) curves showing WT (ccnf +/+), heterozygous (ccnf+/−) and homozygous (ccnf−/−) zebrafish lines (D) RFLP assay showing the PCR amplicons of ccnf+/+, ccnf+/−and ccnf−/− digested with AvaII enzyme. (E) Quantification of ccnf+/− and ccnf−/− mRNA, relative to ccnf +/+ mRNA in 4dpf embryos.

Schematic overview of FUS protein. (A) Graphic illustration of the functional domains of human and zebrafish FUS proteins and their locations. (B) Homology comparison between two species shows 60% identity in amino acids sequences. (C) A pair-wise comparison of the sequence of human FUS and zebrafish Fus displayed by LalnView [8]. (D) Location of ALS-associated FUS mutations.

Generating fus-deficient zebrafish lines. (A) Design of sgRNA targeting the RRM region of fus. (B) −10bp deletion at the TALEN target site resulting in a premature stop codon (*) (C) High resolution melting analysis (HRMA) curves showing WT (fus+/+), heterozygous (fus+/−) and homozygous (fus−/−) zebrafish lines (D) RFLP assay showing the PCR amplicons of fus+/+, fus+/− and fus−/− digested with DraI enzyme. (E) Quantification of fus+/− and fus−/− mRNA, relative to fus+/+ mRNA in 4dpf embryos.

Motor neuron axon growth and length. The average length of six motor neurons above the yolk sac extension were analysed in all three genotypes of (A) ccnf (n = 41 fish) and (B) fus (n = 90). Average motor axon length was analysed per genotype derived from three different clutches. Mean + SEM. Statistical test used: Kruskal-Wallis test, followed by Dunn’s multiple comparisons test.

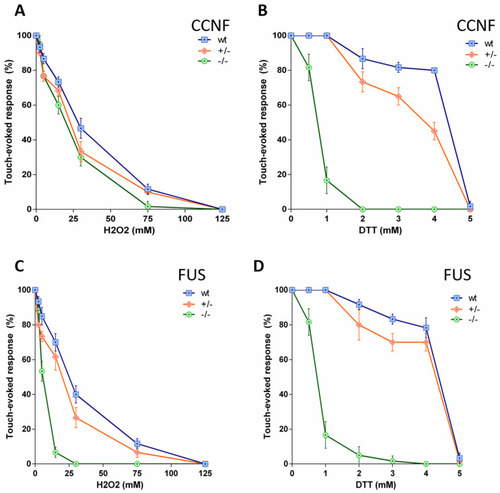
Touch-evoked response of 2dpf zebrafish larvae treated with H2O2 and DTT. (A,B) Dose-response curves for the effect of H2O2 and DTT on the touch-evoked escape response (CCNF; n = 24 zebrafish larvae per genotype and dose). (C,D) Dose-response curves for the effect of H2O2 and DTT on the touch-evoked escape response (FUS; n = 24 zebrafish larvae per genotype and dose).

Photomotor response of ccnf and fus knockout larvae. (A,B) Quantification of average swimming speed (during 4-min in darkness and total distance swum during the 4-min in darkness) revealed that ccnf−/− travelled shorter distances than both ccnf+/− and ccnf+/+. (C,D) Quantification of average swimming speed (during 4-min in darkness and total distance swum during the 4-min in darkness) revealed that fus−/− travelled shorter distances than both fus+/− and fus+/+.

Acknowledgments
This image is the copyrighted work of the attributed author or publisher, and ZFIN has permission only to display this image to its users. Additional permissions should be obtained from the applicable author or publisher of the image. Full text @ Cells