
- Title
-
Characterization of flavonoids with potent and subtype-selective actions on estrogen receptors alpha and beta
- Authors
- Bolt, M.J., Oceguera, J., Singh, P.K., Safari, K., Abbott, D.H., Neugebauer, K.A., Mancini, M.G., Gorelick, D.A., Stossi, F., Mancini, M.A.
- Source
- Full text @ iScience

Screen of 224 flavonoid compounds in PRL-ERα and PRL-ERβ cell lines (A) Representative images of ERα-GFP and dsRed2 FISH under DMSO and 1nM E2 treatment for 1 h. (B) Fraction of cells with a visible array in DMSO and E2 1nM control wells in ERα-GFP:PRL-HeLa screening plates. (C) Fraction of cells showing a visible array after treatment for 1h with 224 flavonoids at 10μM in ERα-GFP:PRL-HeLa cells. Green box represents 3 Z scores above DMSO. (D) For the compounds considered a hit in ERα-GFP:PRL-HeLa, the dsRed2 FISH intensity is calculated relative to E2. The red dot is 10nM 4HT, the yellow dot is 1nM E2. (E) Representative images of GFP-ERβ and dsRed2 FISH following 1h DMSO or 1nM E2 treatment. (F) Fraction of GFPL-ERβ:PRL-HeLa cells with a visible array in DMSO and E2 1nM control wells from screening plates. (G) Fraction of cells showing a visible array after treatment for 1h with 224 flavonoids at 10μM in GFPL-ERβ:PRL-HeLa. Green box represents 3 Z score above DMSO. (H) For the compounds considered a hit in GFPL-ERβ:PRL-HeLa, the dsRed2 FISH intensity is represented relative to E2. The red dot is 10nM 4HT, the yellow dot is 1nM E2. ∗ p value <0.05. Errors bars represent standard deviation. |

Extended dose response library breakdown for hits from flavonoid screen (A) Heatmap representing DNA binding (proportion of cells with array) and dsRed2 FISH intensity at three concentrations for both ERα-GFP:PRL-HeLa and GFPL-ERβ:PRL-HeLa cell lines. The scale represents each features Z score compared to DMSO. (B) Percentage breakdown of the flavonoid library by chemical class. (C) Percent of compounds from each library that hit in each cell line. (D) Normalized dsRed2 FISH intensity for compounds in the screen that reduced FISH signal. Compounds with an asterisk also formed an array. ∗p < 0.05. Error bars represent standard deviation. |

Isobavachin and phenoxodiol are potent activators of estrogen receptor Dose-response curves in ERα-GFP:PRL-HeLa measuring proportion of cells with an array for (A) E2, isobavachin, and phenoxodiol, (B) isobavachin, bavachin, isobavachalcone, neobavaisoflavone, or (C) phenoxodiol, genistein, ±equol, and daidzein. Dose-response curves in ERα-GFP:PRL-HeLa measuring average dsRed2 FISH intensity for (D) E2, isobavachin, and phenoxodiol, (E) isobavachin, bavachin, isobavachalcone, neobavaisoflavone, or (F) phenoxodiol, genistein, ±equol and daidzein. Dose-response curves in GFPL-ERβ:PRL-HeLa measuring proportion of cells with an array for (G) E2, isobavachin, and phenoxodiol, (H) isobavachin, bavachin, isobavachalcone, neobavaisoflavone, or (I) phenoxodiol, genistein, ±equol and daidzein. Dose-response curves in PRL-ERβ measuring average dsRed2 FISH intensity for (J) E2, isobavachin, and phenoxodiol, (K) isobavachin, bavachin, isobavachalcone, neobavaisoflavone, or (L) phenoxodiol, genistein, ±equol and daidzein. (M) Table including compounds structures and calculated EC50. Error bars represent standard deviation. |

Echinatin, isosakuranetin, and loureirin A as activators of estrogen receptors Dose-response curves for ERα-GFP:PRL-HeLa and GFPL-ERβ:PRL-HeLa showing the proportion of cells with a visible array for (A) echinatin, (B) isosakuranetin, and (C) loureirin A. Dose-response curves for ERα-GFP:PRL-HeLa and GFPL-ERβ:PRL-HeLa for normalized dsRed2 FISH intensity for (D) echinatin, (E) isosakuranetin, and (F) loureirin A. (G) GREB1 gene expression in MCF-7 cells with E2 at 10nM and isosakuranetin, echinatin, and loureirin A at 1μM after 24 h of treatment. (H) Proliferation assay in MCF-7 cells. ∗ p value <0.05. Error bars represent standard deviation. |

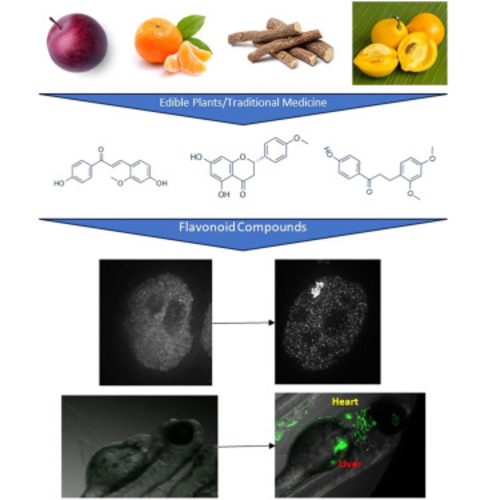
Subtype selectivity of compounds in the flavonoid screen (A) Venn diagram of hits in the ERα-GFP:PRL-HeLa and GFPL-ERβ:PRL-HeLa cell lines. (B) Scatterplot looking at hit compounds ERα-GFP:PRL-HeLa and GFPL-ERβ:PRL-HeLa cell lines. Compounds that were not a hit in a cell line were set at 100000nM dose. Dose-response curve for licochalcone A for (C) proportion of cells with array and (D) normalized dsRed2 FISH intensity. (E) Example images of zebrafish following different treatments. (F) Heatmap showing percent of zebrafish embryos with GFP-positive heart or liver upon a given treatment. n ≥ 18 zebrafish embryos per condition. Error bars represent standard deviation. |
|