
|
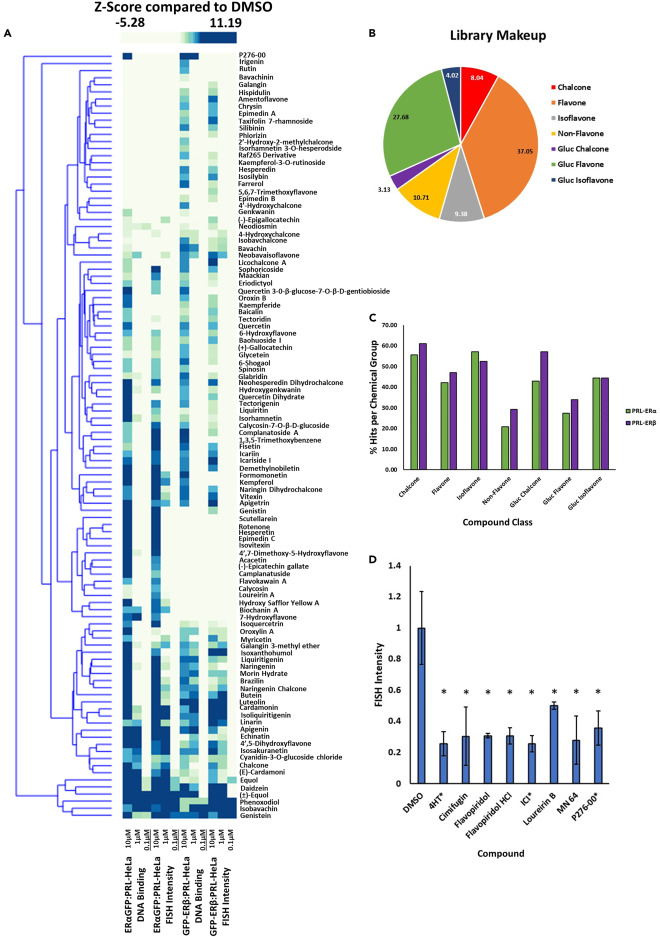
Fig. 2 Extended dose response library breakdown for hits from flavonoid screen (A) Heatmap representing DNA binding (proportion of cells with array) and dsRed2 FISH intensity at three concentrations for both ERα-GFP:PRL-HeLa and GFPL-ERβ:PRL-HeLa cell lines. The scale represents each features Z score compared to DMSO. (B) Percentage breakdown of the flavonoid library by chemical class. (C) Percent of compounds from each library that hit in each cell line. (D) Normalized dsRed2 FISH intensity for compounds in the screen that reduced FISH signal. Compounds with an asterisk also formed an array. ∗p < 0.05. Error bars represent standard deviation.