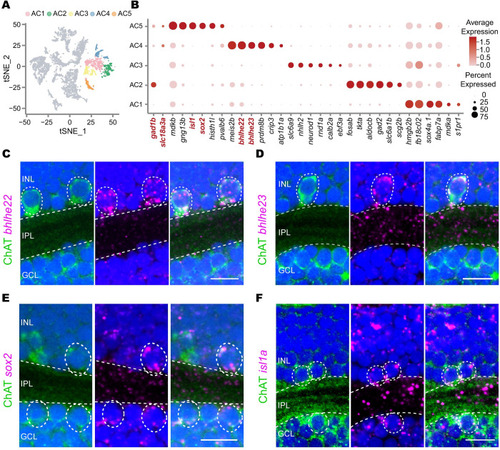
Single-cell RNA-seq identifies 2 GABAergic/cholinergic AC types.

(A) t-SNE plot showing 5 clusters of ACs (in colors) in single-cell RNA-seq data. (B) Expression pattern of marker genes for each cluster in (A). Marker genes gad1b (GABAergic), vachta (cholinergic), sox2 (AC5), bhlhe22 (AC4), glyt1 (AC3), gad2 (AC2), and sox4a (AC1) are highlighted in red. (C-F) Validation of marker TFs for cluster AC4 (C and D) and AC5 (E and F) using in situ hybridization (magenta) combined with ChAT immunostaining (green) of the 5-dpf zebrafish. Dashed circles, ACs with positive signals. Scale bars, 10 μm. AC, amacrine cell; ChAT, choline acetyltransferase; dpf, days post-fertilization; GCL, ganglion cell layer; INL, inner nuclear layer; IPL, inner plexiform layer; TF, transcription factor.

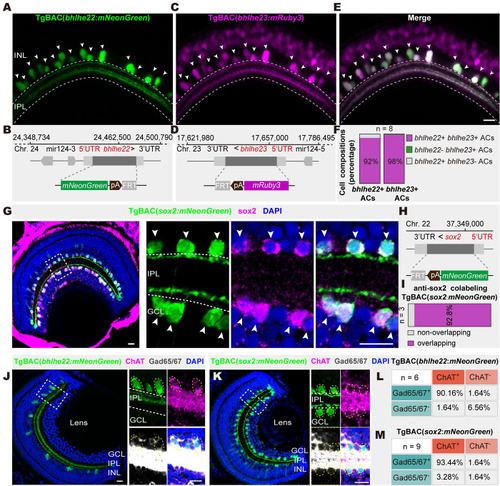
Genetically marking 2 GABAergic/cholinergic AC types.

(A and B) Representative image (A) of derived transgenic line and schematic (B) of BAC construct design of bhlhe22. (C and D) Representative image (C) of derived transgenic line and schematic (D) of BAC construct design of bhlhe23. (E) Merged image of (A) and (C) after crossing transgenic lines TgBAC(bhlhe22:mNeonGreen) with TgBAC(bhlhe23:mRuby3). (F) Cell composition analysis of bhlhe22 and bhlhe23 labeling cells in (E). Larvae used for composition analysis are from TgBAC(bhlhe22:mNeonGreen,bhlhe23:mRuby3), n = 8. (G) Immunostaining of sox2+ ACs in the transgenic fishline TgBAC(sox2:mNeonGreen). Solid white arrow head indicated colocalization of sox2 transgenic fishline and SOX2 antibody. (H) Schematic of BAC construct design of TgBAC(sox2: mNeonGreen). (I) The bar plot showing that the majority of sox2+ ACs in the transgenic fishline is colocalized with SOX2 antibody. (J and K) Images showing the colabeling of bhlhe22 + type (J, green) and sox2+ type (K, green) with ChAT (magenta) and Gad65/67 (gray). (L and M) Quantification in (J and K). Images above are captured from 5-dpf larval fish. Dashed yellow circles, ACs with positive signals. The data underlying this figure can be found in S3 Data. Scale bars, 10 μm. AC, amacrine cell; BAC, bacterial artificial chromosome; ChAT, choline acetyltransferase; dpf, days post-fertilization; GCL, ganglion cell layer; INL, inner nuclear layer; IPL, inner plexiform layer.

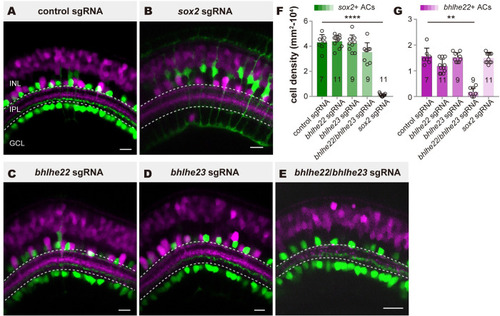
The generation of 2 AC types requires distinct sets of TFs.

(A-E) Representative images showing the distributions of 2 GABAergic/cholinergic ACs labeling by TgBAC(sox2: mNeonGreen,bhlhe23:mRuby3) after injection of control sgRNA(A), bhlhe22 sgRNA (B, bhlhe22 disruption), bhlhe23 sgRNA (C, bhlhe23 disruption), bhlhe22/bhlhe23 sgRNA (D, bhlhe22 and bhlhe23 codisruption), sox2 sgRNA (E, sox2 disruption) at 5 dpf. (F) Quantifications of sox2+ type in (A-E). (G) Quantifications of bhlhe22 + type in (A-E). The data underlying this figure can be found in S3 Data. Data are presented as mean ± SD, Mann–Whitney test. * p < 0.05, ** p < 0.01, *** p < 0.001, **** p < 0.0001. Scale bars, 10 μm. AC, amacrine cell; dpf, days post-fertilization; GCL, ganglion cell layer; INL, inner nuclear layer; IPL, inner plexiform layer; sgRNA, small guide RNA; TF, transcription factor.

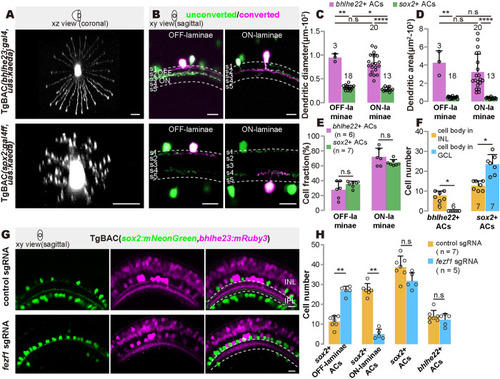
Morphological characteristics of 2 GABAergic/cholinergic AC types.

(A) Representative images showing the dendrites of bhlhe22+ type and sox2+ type. (B) Representative images showing the cell body positioning and dendritic arbors of ON- and OFF-laminae of bhlhe22+ type and sox2+ type. (C and D) Quantification of the dendrite diameters (C) and sizes (D) in (A). Each circle represents one cell at 5 dpf. (E) Quantification of cell fraction of ON- to OFF-laminae in (B). (F) Quantification of the number of cells with cell body located in INL and GCL of bhlhe22+ and sox2+ type. (G) Representative images of bhlhe22+ and sox2+ type after fezf1 disruption. (H) Quantification of the number of ON- and OFF-laminae subtype of sox2+ cells, total sox2+ cells, and total bhlhe22+ cells in (G). Each circle represents one fish at 5 dpf. The data underlying this figure can be found in S3 Data. Scale bars, 10 μm. AC, amacrine cell; dpf, days post-fertilization; GCL, ganglion cell layer; INL, inner nuclear layer; sgRNA, small guide RNA.

Direction selectivity of 2 GABAergic/cholinergic AC types.

(A) Schematic showing the setup of in vivo two-photon calcium imaging of 5- to 8-dpf TgBAC(sox2: gal4ff,uas:sypb-gcamp6s) and TgBAC(bhlhe22:gal4ff,uas:sypb-gcamp6s) fish. (B) The representative image of TgBAC(bhlhe22: gal4ff,uas:sypb-gcamp6s) fish. Dendrites in the section are segmented in tiling yellow rectangle. A single yellow rectangle is an ROI for calcium response analysis. (C) Donut plot showing the composition of responsive and direction-selective bhlhe22+ ROIs to 50-pixels width moving bar. (D) Responses of a representative ROI of DS bhlhe22+ ROIs in (C). Gray traces, repetitively trials; black traces, average of repetitive trials; blue trace, smoothed data of average trace with gaussian method. (E) Polar plot showing the average response at 12 directions of the ROI in (D). (F) The representative image of TgBAC(sox2: gal4ff,uas:sypb-gcamp6s) fish. (G) Donut plot showing the composition of responsive and direction-selective sox2+ ROIs. (H) Responses of a representative ROI of DS sox2+ ROIs in (G). Green trace, smoothed data of average trace with gaussian method. (I) Polar plot showing the average response in 12 directions of the ROI in (H). (J) Cumulative curve of DSI distribution of responsive sox2+ (green) and bhlhe22+ (blue) ROIs. The dashed line indicates the direction-selective threshold, DSI = 0.5. Kolmogorov–Smirnov test. (K) Violin plot of DSI distribution of all responsive sox2+ and bhlhe22+ ROIs. The gray lines indicate the quartiles, and the red lines indicate the median. (L and M) Behavioral paradigm for the OKR assay. (N) The bar plot showing saccade frequency of bhlhe22+ AC-ablated fish (magenta) and sox2+ AC-ablated fish (green) in response to drifting gratings. Each circle represented one fish at 5–8 dpf. (O) The bar plot showing saccade amplitude of bhlhe22+ AC-ablated fish (magenta) and sox2+ AC-ablated fish (green) in response to drifting gratings. Each circle represented one fish at 5–8 dpf. The data underlying this figure can be found in S3 Data. Data are presented as mean ± 95% CI, Mann–Whitney test, n.s > 0.005, ** p < = 0.005, *** p < 0.001, **** p < 0.0001. AC, amacrine cell; dpf, days post-fertilization; DS, direction selective; DSI, direction selectivity index; OKR, optokinetic reflex; ROI, region of interest; sgRNA, small guide RNA.

bhlhe22+ and sox2+ type show conversely preference to object size.

(A and B) Representative capture (A) and donut plot (B) showing the responsive cell ratio of bhlhe22+ type to a small (2/5/10) and large (10/50/250) bar widths serial together. (C and D) Representative capture (C) and donut plot (D) showing the responsive cell ratio of sox2+ type to a small (2/5/10) and large (10/50/250) bar widths serial together. Rectangle on the capture showing an ROI of calcium activity analysis. (E and F) Bar plot showing the response amplitude of bhlhe22+ and sox2+ responsive type to small (E, n = 40 and n = 34 of bhlhe22+ and sox2+ type soma, respectively) and large (F, n = 98 and n = 104 of bhlhe22+ and sox2+ type soma, respectively) bar widths serial. Friedman test and subsequent Dunn’s multiple comparisons test within pairing wise groups (3 groups within small or large range). Mann–Whitney test between bhlhe22+ and sox2+ type groups. (G and H) Bar plot showing the responsive cell fraction of bhlhe22+ and sox2+ responsive type from TgBAC(bhlhe22: gal4ff,uas:gcamp6s) and TgBAC(sox2:gal4ff,uas:gcamp6s) to small (G,n = 14 and n = 11 of bhlhe22+ and sox2+ type animal, respectively) and large (H,n = 10 and n = 16 of bhlhe22+ and sox2+ type animal, respectively) bar widths serial. The data underlying this figure can be found in S3 Data. Scale bars, 10 μm. n.s > = 0.05, * p < 0.05, ** p < 0.01, *** p < 0.001, **** p < 0.000.

Acknowledgments
This image is the copyrighted work of the attributed author or publisher, and ZFIN has permission only to display this image to its users. Additional permissions should be obtained from the applicable author or publisher of the image. Full text @ PLoS Biol.