IMAGE

Fig 5

ID
ZDB-IMAGE-240306-53
Source
Figures for Li et al., 2024
Image
Figure Caption

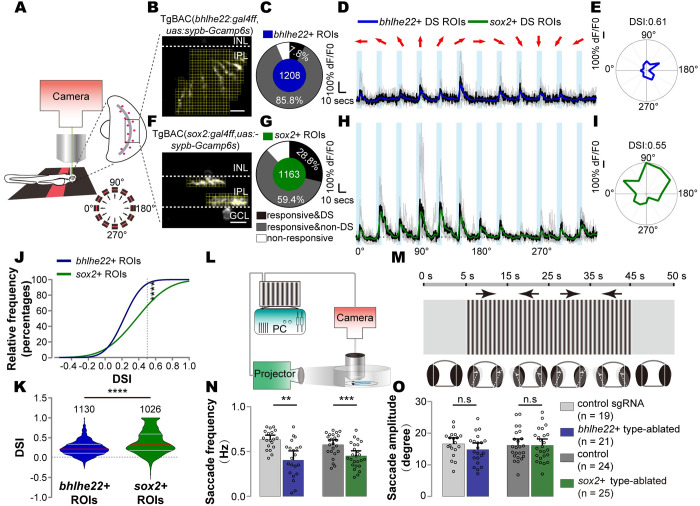
Fig 5 Direction selectivity of 2 GABAergic/cholinergic AC types.

(A) Schematic showing the setup of in vivo two-photon calcium imaging of 5- to 8-dpf TgBAC(sox2: gal4ff,uas:sypb-gcamp6s) and TgBAC(bhlhe22:gal4ff,uas:sypb-gcamp6s) fish. (B) The representative image of TgBAC(bhlhe22: gal4ff,uas:sypb-gcamp6s) fish. Dendrites in the section are segmented in tiling yellow rectangle. A single yellow rectangle is an ROI for calcium response analysis. (C) Donut plot showing the composition of responsive and direction-selective bhlhe22+ ROIs to 50-pixels width moving bar. (D) Responses of a representative ROI of DS bhlhe22+ ROIs in (C). Gray traces, repetitively trials; black traces, average of repetitive trials; blue trace, smoothed data of average trace with gaussian method. (E) Polar plot showing the average response at 12 directions of the ROI in (D). (F) The representative image of TgBAC(sox2: gal4ff,uas:sypb-gcamp6s) fish. (G) Donut plot showing the composition of responsive and direction-selective sox2+ ROIs. (H) Responses of a representative ROI of DS sox2+ ROIs in (G). Green trace, smoothed data of average trace with gaussian method. (I) Polar plot showing the average response in 12 directions of the ROI in (H). (J) Cumulative curve of DSI distribution of responsive sox2+ (green) and bhlhe22+ (blue) ROIs. The dashed line indicates the direction-selective threshold, DSI = 0.5. Kolmogorov–Smirnov test. (K) Violin plot of DSI distribution of all responsive sox2+ and bhlhe22+ ROIs. The gray lines indicate the quartiles, and the red lines indicate the median. (L and M) Behavioral paradigm for the OKR assay. (N) The bar plot showing saccade frequency of bhlhe22+ AC-ablated fish (magenta) and sox2+ AC-ablated fish (green) in response to drifting gratings. Each circle represented one fish at 5–8 dpf. (O) The bar plot showing saccade amplitude of bhlhe22+ AC-ablated fish (magenta) and sox2+ AC-ablated fish (green) in response to drifting gratings. Each circle represented one fish at 5–8 dpf. The data underlying this figure can be found in S3 Data. Data are presented as mean ± 95% CI, Mann–Whitney test, n.s > 0.005, ** p < = 0.005, *** p < 0.001, **** p < 0.0001. AC, amacrine cell; dpf, days post-fertilization; DS, direction selective; DSI, direction selectivity index; OKR, optokinetic reflex; ROI, region of interest; sgRNA, small guide RNA.

Acknowledgments
This image is the copyrighted work of the attributed author or publisher, and ZFIN has permission only to display this image to its users. Additional permissions should be obtained from the applicable author or publisher of the image. Full text @ PLoS Biol.