FIGURE SUMMARY
Title

Cebp1 and Cebpβ transcriptional axis controls eosinophilopoiesis in zebrafish

Authors
Li, G., Sun, Y., Kwok, I., Yang, L., Wen, W., Huang, P., Wu, M., Li, J., Huang, Z., Liu, Z., He, S., Peng, W., Bei, J.X., Ginhoux, F., Ng, L.G., Zhang, Y.
Source
Full text @ Nat. Commun.

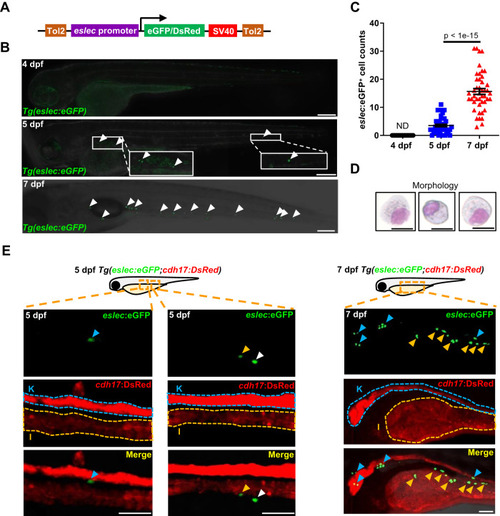
The early spatial-temporal development and function of zebrafish eosinophils.

A Design of vector for generating Tg(eslec:eGFP) or Tg(eslec:DsRed) line. The eGFP or DsRed fluorescence is driven by the 4.3 kb eslec promoter and terminated by the SV40 terminator. Tol2 system was used to integrate these elements into the zebrafish genome. B Temporal development pattern of early eosinophils. No eosinophil could be found in 4 dpf larvae, while they start to emerge from 5 dpf onwards and increase at 7 dpf (white arrowhead, bar = 200 μm, white box showing enlarged view). C Quantification of B. The eosinophil populations were analyzed by Student’s t-test (two-sided, mean ± SEM, ND means not detectable). Sample size: 4 dpf, n = 30; 5 dpf, n = 45; 7 dpf, n = 45. Three independent experiments were conducted. D Morphologies of eslec+ cells. The eGFP+ cells were sorted from 7 dpf Tg(eslec:eGFP) larvae and applied to May-Giemsa staining (bar = 10 μm). Two independent experiments were conducted. E Spatial development pattern of early eosinophils. The kidney and intestine are respectively marked by “K” or “I” and surrounded by dotted lines, based on the cdh17 expression. The eosinophils located in the kidney, intestine, or possibly peritoneal fluid are respectively marked by blue, yellow, or white arrowhead (bar = 50 μm). Two independent experiments were conducted. Source data are provided as a Source Data file.

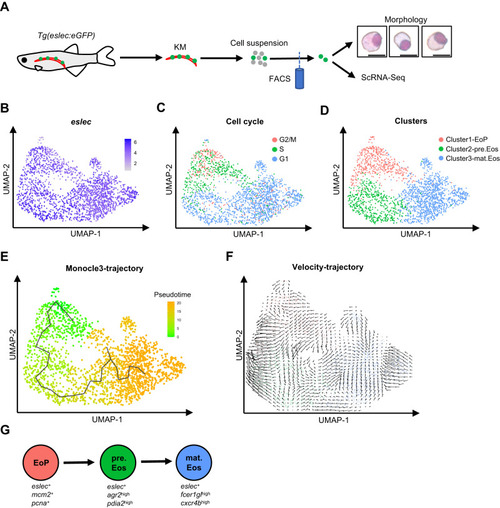
Landscape of the eosinophilic cell lineage.

A Design of the scRNA-Seq analysis. Adult Tg(eslec:eGFP) kidneys were dissected and pipette-mixed into cell suspensions. The eGFP+ cells were sorted and stained with May-Giemsa to check their morphologies (bar = 10 μm, two independent experiments were conducted). Finally, the eslec:eGFP+ cells were applied to scRNA-Seq analysis. B UMAP showing that all analyzed cells were eslec+. C UMAP showing the cell cycle status of KM eosinophilic cells. D UMAP showing the clustering information of KM eosinophilic cell. E Monocle3-trajectory of the eosinophil lineage. Pseudotime status of eosinophils were calculated with Monocle3. F Velocity-trajectory of the eosinophil lineage. RNA velocity stream plot shows the directional flow of eosinophils. G Model of the eosinophilic cell lineage. The KM eosinophils are sub-clustered into three stages, namely EoP (eslec+mcm2+pcna+), pre.Eos (eslec+agr2highpdia2high), and mat.Eos (eslec+fcer1glhighcxcr4bhigh).

Cebp1 inhibits the commitment of eosinophils.

A Mutation of cebp1 enhanced eosinophilopoiesis. Eosinophil (red arrowhead) numbers were increased in 7 dpf cebp1 mutant larvae (bar = 200 μm). Quantification was performed using Student’s t-test (two-sided, mean ± SEM). Sample size: Sibling, n = 27; cebp1−/−, n = 10. Three independent experiments were conducted. B Overexpression of cebp1 inhibited eosinophilopoiesis. Eosinophil (red arrowhead) numbers were decreased in 7 dpf Tg(hsp70:cebp1-eGFP) larvae (bar = 200 μm). Quantification was performed using Student’s t test (two-sided, mean ± SEM). Sample size: Control, n = 23; hsp70:cebp1-eGFP, n = 19. Three independent experiments were conducted. C UMAP showing the scRNA-Seq clustering information. KM cells of WT and cebp1−/− zebrafish were integrated and analyzed by scRNA-Seq analysis. The purple, green, and yellow dotted line-surrounding regions respectively indicate the eosinophil lineage, neutrophil lineage, and atypical cell cluster of each sample. Eosinophil lineage cells of each sample were further subclustered and the enlarged view (black-boxed region) is shown. D Subcluster annotation reference. The expression patterns of eslec and the markers of each cluster (Eb-P: ncf2 and myca; EoP: mcm2 and pcna; pre.Eos: agr2 and pdia2; mat.Eos: fcer1gl and cxcr4b) are shown by violin plots. E Eosinophil lineage profile with cebp1 mutation. Percentages of eosinophil lineage cells of different stages were analyzed in WT and cebp1−/− zebrafish (n = 3, Student’s t test, two-sided, mean ± SEM). Source data are provided as a Source Data file.

Cebpb is directly suppressed by Cebp1.

A Design of Cebp1-target screening. RNA-Seq was performed with cebp1+/+ and cebp1−/− eosinophils to identify upregulated genes with cebp1 mutation (1,372 genes, q < 0.05, baseMean > 50, log2 fold change > 0.7). ChIP-Seq was performed with Tg(hsp70:cebp1-eGFP) larvae to identify Cebp1-binding genes (543 genes, q < 0.05, peak fold enrich > 2, TSS ± 2 kb). B GO/KEGG analysis of overlapping genes. Fifty-eight genes were found to overlap in the Cebp1-binding genes and upregulated genes of cebp1−/− eosinophils. C Heatmap showing the top 10 highest expressed genes of all the overlapping genes. D RT-qPCR showing the relative cebpb expression in WT and cebp1−/− eosinophils. (Student’s t test, two-sided, mean ± SEM). Three independent experiments were conducted with n = 3 in each group. E Cebp1 binding on the 3′ UTR of cebpb. At the bottom panel, the direction of cebpb transcription is marked with a black arrow, and the broad box and narrow box represent the coding sequence and UTR region, respectively. The red dotted box shows the binding peaks. F Cebp1 inhibiting the expression of cebpb. Luciferase assay demonstrated that Cebp1 inhibited the luciferase activities when the 3′UTR of cebpb was added after the luciferase gene (Luc) (Student’s t test, two-sided, mean ± SEM, ns represents no significance). Three independent experiments were conducted with n = 4 in each group. Source data are provided as a Source Data file.

Cebpβ promotes the commitment of the eosinophil lineage.

A Cebpβ is a positive regulator of eosinophilopoiesis. Eosinophil (red arrowhead) numbers were found to decrease in 7 dpf cebpb mutant larvae (bar = 200 μm). Quantification was performed using Student’s t-test (two-sided, mean ± SEM). Sample size: Sibling, n = 51; cebpb−/−, n = 13. Three independent experiments were conducted. B Overexpression of cebpb enhanced eosinophilopoiesis. Eosinophil (red arrowhead) numbers were increased in 7 dpf Tg(hsp70:cebpb-eGFP) larvae (bar = 200 μm). Quantification was performed using Student’s t test (two-sided, mean ± SEM). Sample size: Control, n = 23; hsp70:cebpb-eGFP, n = 10. Three independent experiments were conducted. C UMAP showing the scRNA-Seq clustering information. KM cells of WT and cebpb−/− zebrafish were integrated and analyzed by scRNA-Seq analysis. The dotted line-surrounding regions indicate the eosinophil lineage of each sample, which were further subclustered and the enlarged view is shown. D Eosinophil lineage profile with cebpb mutation. Percentages of eosinophil lineage cells of different stages were analyzed in the KM of WT and cebpb−/− zebrafish (n = 3, Student’s t test, two-sided, mean ± SEM, ND means not detectable). Source data are provided as a Source Data file.

Cebpβ promotes eosinophilopoiesis by regulating pre.Eos-related genes.

A Design of Cebpβ-target screening. RNA-Seq was performed with cebpb+/+ and cebpb−/− eosinophils to identify downregulated genes with cebpb mutation (470 genes, q < 0.05, baseMean > 50, log2 fold change > 0.7). ChIP-Seq was performed with Tg(hsp70:cebp1-eGFP) larvae to identify Cebpβ-binding genes (3381 genes, q < 0.05, peak fold enrich > 2, TSS ± 2 kb). B Downstream targets of Cebpβ. Seventy-five genes were found overlapped from the Cebpβ-binding genes and the downregulated genes with cebpb mutation. GO/KEGG analysis suggested that these genes are associated with ribosome (Red). The genes related to this GO term and eslec were exhibited by RNA-Seq heatmap. C Cebpβ binding on the proximal promoter of eslec. At the bottom panel, the direction of eslec transcription is marked with a black arrow, and the broad box and narrow box represent the coding sequence and UTR region, respectively. The red dotted box shows the binding peaks.

Cebp1 is the orthologue of human C/EBPεP27 in suppressing eosinophilopoiesis.

A Full Cebpe knockout affects both neutrophils and eosinophils in mice. BM cells of Cebpe+/+ and Cebpe−/− mice were collected, stained with 15 different antibodies, and applied to flow cytometry analysis. The UMAPs were shown, representing the clustering information of mouse BM cells. Red circles marked the eosinophils, while the black-dotted regions marked the atypical granulocytes. The entire annotation information was shown on the right panel. B Neutrophil-specific Cebpe knockout induces atypical granulocytes in mice. BM cells of Cebpefl/fl and Mrp8creCebpefl/fl mice were collected, stained with 15 different antibodies, and applied to flow cytometry analysis. The UMAPs were shown, representing the clustering information of mouse BM cells. C Overexpression of human C/EBPεp27 mimicked Cebp1 phenotype. WT embryos were injected with coro1a-drived overexpression plasmids at 1-cell stage, then screened at 1 dpf based on eGFP signals, and finally collected at 7 dpf for WISH. Eosinophil (red arrowhead) numbers were decreased in larvae injected with coro1a:cebp1-eGFP (DrCebp1) or coro1a:CEBPEp27-eGFP (HsC/EBPεp27) plasmid, while remained unchanged in other groups (bar = 200 μm). Quantification was performed using Student’s t test (each group was only compared with coro1a:eGFP (eGFP) control, two-sided, mean ± SEM, ns represents no significance). Sample size: eGFP, n = 17; DrCebp1, n = 14; HsC/EBPεp27, n = 15; HsC/EBPεp14, n = 20; HsC/EBPεp30, n = 22; HsC/EBPεp32, n = 23; MmC/EBPε, n = 18. Three independent experiments were conducted. Source data are provided as a Source Data file.

The working model showing zebrafish Cebps in balancing granulopoiesis.

HSC or myeloid progenitor (MP) undergo stepwised differentiation for granulopoiesis. The neutrophil lineage cells contain proNeu1, proNeu2, pre.Neu, and mat.Neu, which nomenclature is based on a previous study39. The eosinophil lineage cells contain Eb-P, EoP, pre.Eos, and mat.Eos. For granulopoiesis, Cebp1 is essential for the generation of the neutrophil lineage, and Cebp1 suppresses Cebpβ to inhibit the commitment and differentiation of the eosinophil lineage.

Acknowledgments
This image is the copyrighted work of the attributed author or publisher, and ZFIN has permission only to display this image to its users. Additional permissions should be obtained from the applicable author or publisher of the image. Full text @ Nat. Commun.