FIGURE SUMMARY
Title

Deficiency of copper responsive gene stmn4 induces retinal developmental defects

Authors
Jing, Y., Luo, Y., Li, L., Liu, M., Liu, J.X.
Source
Full text @ Cell Biol. Toxicol.

Stmn4 deficiency led to eye morphological defects. (A) Copper (Cu) stress induced obviously reduced expression of stmn4 in eyes during zebrafish embryogenesis (A1 − A4), cross-section of the eye (A5, A6) and the calculation of the relative expression levels of stmn4 (A7). (B) Western blot detection of Stmn4 protein levels in WT and stmn4−/− at 24 hpf and 48 hpf (B1 − B2), and the mRNA levels of stmn4 in WT and stmn4−/− at 24 and 48 hpf (B3), respectively. (C) Embryonic and eye development in stmn4−/− and WT embryos and larvae at different developmental stages (C1 − C12), and the quantification of the eye size in WT and stmn4−/− embryos and larvae (C13), respectively. (D) HE staining showed the difference in the eyes of WT and stmn4−/−embryos at 48 hpf (D1 − D4), and the calculation data (D5, D6). ONL, outer nuclear layer; INL, inner nuclear layer; GCL, ganglion cell layer. A1, A2, lateral view, anterior to the left, and dorsal to the up; A3, A4, head to the up, and dorsal to the down; C1 − C12, lateral view, anterior to the up, and dorsal to the right. Scale bar, 200 μm (A1 − A4), 100 μm (A5, A6, C1 − C12, D1, D2), 50 μm (D3, D4). ***P < 0.001, **P < 0.01, *P < 0.05

Defects of retinal cell development in stmn4−/−. (A) Expressions of retinal opn1lw1, opn1sw2, rhodopsin, and opn1mw1 at 72 hpf in WT and stmn4−/− zebrafish larvae (A1 − A8), and the calculation of the relative expression levels in each sample (A9). (B) Expression of retinal fluorescence in Tg (Huc: EGFP) and Tg (stmn4−/−; Huc: EGFP) at 48 hpf zebrafish embryos (B1 − B4) and 7 dpf zebrafish larvae (B6 − B9), and the quantification of relative fluorescence in each sample (B5, B10). (C) Immunofluorescence assays for the Opn1sw2, Opn1lw1 and Rhodopsin expression at 96 hpf in WT and stmn4−/− zebrafish larvae (C1 − C8, C10 − C17, C19 − C26), and the quantification of relative fluorescence in each sample (C9, C18, C27). A1 − A8, head to the up, and dorsal to the down; B1 − B4, B6 − B9, lateral view, anterior to the left, and dorsal to the up. Scale bar, 200 μm (A1 − A8), 100 μm (B1 − B4, B6 − B9), 50 μm (C1 − C8, C10 − C17, C19 − C26), 25 μm (C7, C8, C16 − C17, C25 − C26). ***P < 0.001, **P < 0.01, *P < 0.05

Stmn4 deficiency induced impaired differentiation of RPCs in retina. (A) Expression of sox2 at 8 hpf, 24 hpf, 48 hpf, and 72 hpf in WT and stmn4−/− embryos and larvae (A1 − A8), and the calculation of the relative expression levels of sox2 (A9). (B) Western blot analysis of Sox2 at 24 hpf in WT and stmn4−/− embryos (B1), and the calculation of the relative expression levels of Sox2 (B2). (C) Immunofluorescence assays for the expression of Sox2 at 24 hpf and 48 hpf in WT and stmn4−/− embryos (C1 − C6, C8 − C13), and the calculation of the relative expression levels (C7, C14). (D) Expression of vsx2 and ccnd1 at 24 hpf in zebrafish embryos (D1 − D8), and the calculation of the relative expression levels (D9). (E) Expression of ccnd1 at 48 hpf and 60 hpf in zebrafish embryos (E1 − E4, E7 − E10), cross-section of the eye (E5, E6, E11 − E12), and the calculation of the relative expression levels (E13). (E) Expression of crx at 48 hpf and 60 hpf in zebrafish embryos (F1 − F4, F7 − F10), cross-section of the eye (F5, F6, F11 − F12), and the calculation of the relative expression levels (F13). A1 − A8, D1, D2, D5, D6, E1, E2, E7, E8, F1, F2, F7, F8, lateral view, anterior to the left, and dorsal to the up; D3, D4, D7, D8, E3, E4, E9, E10, F3, F4, F9, F10, head to the up, and dorsal to the down. Scale bar, 200μm (A1 − A8, D1 − D8, E1 − E4, E7 − E10, F1 − F4 and E7 − E10), 100 μm (E5, E6, E11 − E12, F5, F6 and F11 − F12), 50 μm (C1 − C6 and C8 − C13). ***P < 0.001, **P < 0.01, ns, not significant

Stmn4 mRNA could effectively rescue retinal developmental defects in both Cu stressed embryos and stmn4−/− mutants. (A) Stmn4 mRNA effectively rescued the changed expression of elavl3 and crx in retina in Cu stressed embryos (A1 − A8, A10 − A17), and the calculations of the relative expressions of elavl3 and crx in embryos from each group (A9, A18). (B) Stmn4 mRNA effectively rescued the changed expression of sox2 in stmn4−/− mutants (B1 − B8), and the calculations of the relative expressions of sox2 in embryos from each group (B9). A1 − A4, A10 − A13, B1 − B4, lateral view, anterior to the left, and dorsal to the up; A5 − A8, A14 − A17, B5 − B8, head to the up, and dorsal to the down. Scale bar, 200 μm (A1 − A8, A10 − A17, B1 − B8). ***P < 0.001, **P < 0.01, *P < 0.05, ns, not significant

RPCs in stmn4−/− mutants arrested in M-phase and showed abnormal mitosis. (A) Brdu cell proliferation assays in WT and stmn4−/− zebrafish embryos at 48 hpf (A1 − A8) and the calculation data (A9). (B) PH3 cell proliferation assays in WT and stmn4−/− zebrafish embryos at 48 hpf (B1 − B6) and the calculation data (B7). (C) TUNEL assays in WT and stmn4−/− zebrafish embryos at 48 hpf (C1 − C6) and the calculation data (C7). (D) Immunofluorescence assays for cytoskeleton Tubulin in zebrafish embryo at 48 hpf (D1 − D8) and the calculation data (D9). Scale bar, 50 μm (A1 − A6, B1 − B6, C1 − C6), 25 μm (A7, A8), 10 μm (D1 − D8). ***P < 0.01, ns, not significant

Expression of cell cycle genes in stmn4−/− mutants. (A) GO pathway of apoptosis and mitosis were enriched for DEGs in stmn4−/− mutants at 24 hpf. (B) Heatmaps of the down-regulated cell cycle related DEGs (B1, B2). (C) qRT-PCR assays for the cell cycle related genes in zebrafish embryo at 16 hpf and 24 hpf (C1, C2). (D) Expression of Cdc25b, Ccnb1, Cdk1, Tubulin in zebrafish embryo at 24 hpf and 48 hpf (D1), and the calculation of the protein levels in each sample (D2 − D5). ***P < 0.001, **P < 0.01, *P < 0.05

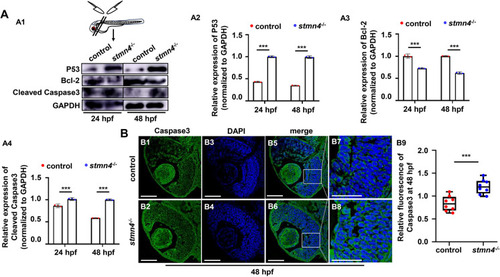
Stmn4 deficiency led to changed expressions of apoptotic proteins. (A) Expression of P53, Bcl-2, and Cleaved Caspase3 in head of WT and stmn4−/− mutants at 24 hpf and 48 hpf (A1), respectively, and the calculation of the protein levels in each sample (A2 − A4). (B) Immunofluorescence assays of Caspase3 in WT and stmn4−/− retina at 48 hpf (B1 − B8) and the calculation data (B9). Scale bar, 50 μm (B1 − B6), 25 μm (B7, B8). ***P < 0.001

Stmn4 deficiency induced apoptosis of RPCs independent on P53. (A) TUNEL and Sox2 staining in WT (A1 − A5), in stmn4−/− (A6 − A10), in WT embryos injected with p53 MO (A11 − A15), and in stmn4-/- injected with p53 MO (A16 − A20) and the calculation data (A21 − A22). Scale bar, 50 μm (A1 − A4, A6 − A9, A11 − A14, A16 − A19), 25 μm (A5, A10, A15, A20). ***P < 0.001, **P < 0.01, *P < 0.05, ns, not significant

Acknowledgments
This image is the copyrighted work of the attributed author or publisher, and ZFIN has permission only to display this image to its users. Additional permissions should be obtained from the applicable author or publisher of the image. Full text @ Cell Biol. Toxicol.