FIGURE SUMMARY
Title

High-resolution tracking of unconfined zebrafish behavior reveals stimulatory and anxiolytic effects of psilocybin

Authors
Braun, D., Rosenberg, A.M., Rabaniam, E., Haruvi, R., Malamud, D., Barbara, R., Aiznkot, T., Levavi-Sivan, B., Kawashima, T.
Source
Full text @ Mol. Psychiatry

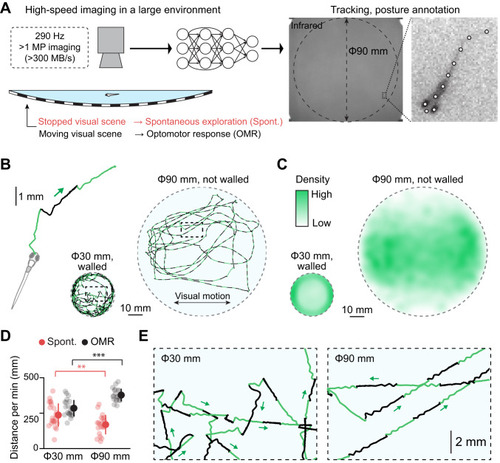
High-resolution, high-speed tracking of zebrafish behavior in a large environment.

A Schematic illustration of our experimental setup and analysis pipeline. Fish swam in an arena where visual stimuli were projected underneath. We acquired high-resolution images at a speed of 290 Hz across the arena of up to 90 mm in diameter. Data analysis pipelines based on a deep neural network identified the fish loci and body postures. We measured spontaneous exploration while the visual stimuli are stopped (Spont.), and visually-induced optomotor response (OMR) while the visual stimuli are moving. See Fig. S1A and the “Methods” section for details. B Head centroid trajectories in a small, walled environment (30 mm) and a large, unwalled environment (90 mm). Each swim episode is colored in either light green or black to separate different swim episodes visually. C Distributions of head centroids during experiments across tested fish. N = 22 and N = 20 fish for the small and large dishes, respectively. D Swimming distance per minute during spontaneous exploration (red) and optomotor response (OMR, black). Transparent circles represent individual fish. **p = 0.0081; ***p = 1.7 × 10⁶ from 2-sample t-test. Error bars represent standard deviations across tested fish. E Expanded head centroid trajectories from the outlined central parts of the small arena (left) and the large arena (right) from (B). The large environment facilitates straight swim patterns.

Large environment expands behavioral repertoires with less confinement artifacts.

ASwim velocities (gray), tail motions (black) and head centroid motions (green) during multiple swim episodes. Triangles represent the onset of individual swim episodes. B Swim parameters and tail motion parameters for independent component analyses (ICA). C ICA weights for component #1 (gray) and component #2 (white). We used tail angle as a power of 0.4 because it best correlated with the swim distance (Fig. S2D). Swim parameters and tail motion parameters were Z-scored individually before performing ICA. D Scatter density plot of various swim patterns in the ICA space reveals enriched repertoires of swimming in a large environment. Left, head centroid trajectories and tail motions of four representative swim patterns. Right, scatter density plots of swim patterns in the small and large environment during spontaneous exploration (red) and optomotor response (black) in the ICA space. The same number (1200) of randomly selected swim events from N = 22 and N = 20 fish for the small and large dishes, respectively, were plotted for each condition. The loci of four representative swim patterns on the left are marked in black circles. The larger environment (90 mm) facilitated rapid long scooting (IC1) during optomotor response and fewer turnings/escapes (IC2) during both spontaneous exploration and optomotor response.

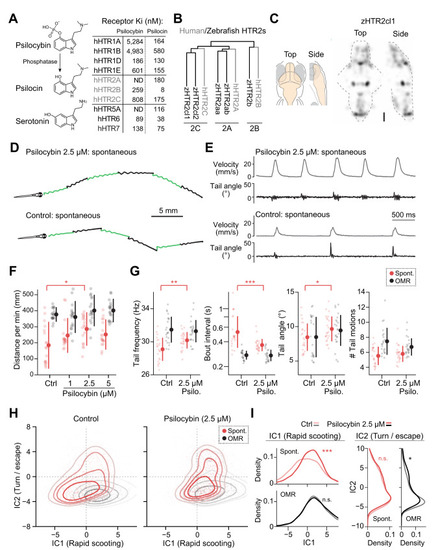
Psilocybin has stimulatory effects on spontaneous exploration.

A Affinities of psilocybin and its metabolite psilocin to human serotonin receptors. Upon ingestion, psilocybin is metabolized by endogenous phosphatases into psilocin, which is structurally similar to serotonin. Psilocin has nanomolar affinities to a wide range of serotonin receptors. Affinities values are taken from a reference [48]. B Unbiased homology analysis of protein sequences revealed conserved subclasses of type 2 serotonin receptors between zebrafish and humans. C Average expression map of HTR2cl1 gene across 5 zebrafish brains obtained by using RNA fluorescence in situ hybridization. Scale bar, 100 μm. See “Methods” for details. D Head trajectories of psilocybin-treated and control fish during spontaneous exploration. E Psilocybin evokes rapid scooting behaviors during spontaneous exploration. F At a concentration of 2.5 μM, psilocybin significantly enhances swimming distances during spontaneous exploration but not during optomotor response. N = 18 fish for each condition. *p = 0.011 from Tukey’s post-hoc test after one-way ANOVA detected a significant difference (F = 3.6) among groups for spontaneous swimming distance. G Psilocybin significantly enhanced tail frequency, shortened bout intervals, and slightly enhanced tail angles during spontaneous swimming. N = 22 and 23 fish for control and 2.5 μM conditions, respectively. P values are from a 2-sample t-test between groups. **p = 0.0051 (frequency); ***p = 8.6 × 10⁻⁴ (interval); *p = 0.044 (angle). H Independent component analysis (ICA) reveals the shift of spontaneous swim patterns toward the distribution of optomotor response along the IC1 axis. I Psilocybin significantly enhances rapid scooting (IC1) during spontaneous exploration, while it does not cause a significant increase in turning/escape behaviors (IC2). Statistical analyses of IC1 components were performed by using kernel density 2-sample test (see “Methods”). We included 6128 (control) and 9395 (2.5 μM) swim episodes for the statistics of spontaneous exploration and 6413 (control) and 6427 (2.5 μM) swim episodes for the statistics of optomotor response. ***p = 3.3 × 1065 and *p = 0.013 between the control group and those after exposure to 2.5 μM psilocybin. n.s., not significant (p > 0.05). Error bars represent standard deviations across tested fish.

Psilocybin prevents stress-induced behavioral changes.

A Behavioral paradigms for psilocybin treatment and acute cold shock. Shaded boxes indicate changed temperature or drug conditions. B Cortisol induction by stress exposure and psilocybin treatments. N = 11 samples for each fish. ***p = 9.6 × 10⁶ and 2.1 × 10⁸ for psilocybin and psilocybin/stress, respectively. *p = 0.026 for stress. We used Dunnett’s multiple comparison test against the control. C Swimming distances during spontaneous exploration (red) and optomotor response (black). N = 14 (C), 14 (S), and 15 (P/S) fish. *p = 0.021 from Tukey’s post-hoc test between the control and P/S conditions after one-way ANOVA detected significant differences among groups for spontaneous swimming distance. D Acute cold shock induced zig-zag swim patterns during optomotor response, and psilocybin prevented such stress-induced behavioral changes. ELeft, independent component analysis (ICA) revealed the shift of swim patterns toward turn/escape behavior (IC2) after cold shock. Pretreatment with psilocybin prevented such a shift. Right, statistical analyses of the occurrences of turning/escape behaviors along the IC2 axis. We used kernel density 2-sample test (see “Methods”). We included 4216 (C), 3833 (S) and 4872 (P/S) swim episodes for the statistics of spontaneous exploration, and 3312 (C), 2713 (S) and 2706 (P/S) swim episodes for the statistics of optomotor response. ***p = 1.8 × 1031 (C vs. S) and 3.0 × 10⁸ (S vs. P/S) during spontaneous exploration. ***p = 1.0 × 10⁷ (C vs. S) during optomotor response. F Statistical analyses of the stimulatory effect along the IC1 axis. ***p = below 1.0 × 10200 (C vs. S) and 1.7 × 1035 (S vs. P/S) during spontaneous exploration. ***p = 4.8 × 10⁵ (S vs. P/S) during optomotor response. G Analyses of individual swim parameters. Acute cold shock significantly increased tail frequency, tail angle and the number of tail motions, while such an effect was not observed in fish pretreated with psilocybin. Statistical tests used Tukey’s post-hoc test after one-way ANOVA among different conditions during spontaneous explorations: **p = 0.0035 (tail frequency); *p = 0.032 (tail angle); *p = 0.046 (tail motions). Error bars represent standard deviations across tested fish. H, I Psilocybin ameliorates dark-avoidance behavior in larval zebrafish. H, representative swimming trajectories of the control and psilocybin-treated fish during a 5-min spontaneous exploration in an environment with light and dark areas. The numbers of plotted swim events are shown at the bottom of the panel. I, spatial distribution of swim events relative to the border between the light and dark areas in control (gray) and psilocybin-treated (black) fish. We analyzed 23,103 and 27,303 swim events from 30 control and 30 psilocybin-treated fish, respectively. Density plots, as well as binned histograms (9-mm intervals) from individual fish, were plotted. Error bars represent the standard error of the mean (s.e.m.) across the tested fish. **p = 0.0082 from kernel density 2-sample test between the control and psilocybin-treated fish.

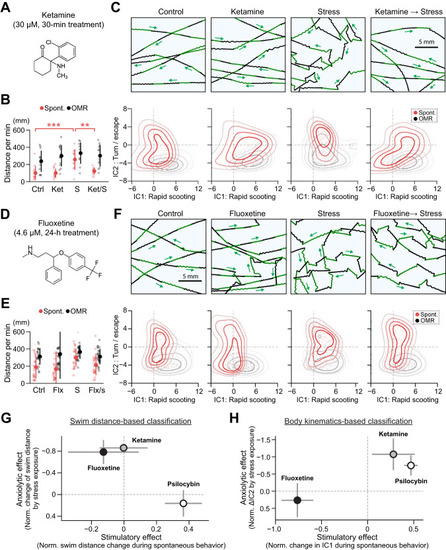
Comparison with fast-acting and slow-acting antidepressants.

A Chemical structure and dosage of ketamine (Ket). B Swimming distances during spontaneous exploration (red) and optomotor response (black). N = 12 (C), 14 (Ket), 10 (S) and 12 (Ket/S) fish. ***p = 1.4 × 10⁴ (C vs. S) and **p = 1.7 × 10³ (S vs. Ket/S) from Tukey’s post-hoc test after one-way ANOVA for spontaneous swimming distance. CTop, acute cold shock induced zig-zag swim patterns during optomotor response, and pre-exposure to ketamine prevented such stress-induced behavioral changes. Bottom, independent component analysis (ICA) revealed the shift of swim patterns toward turn/escape behavior (IC2) after cold shock, which was prevented by ketamine. See Fig. S5A for statistical analyses. D Chemical structure and dosage of fluoxetine (Flx). E Swimming distances during spontaneous exploration (red) and optomotor response (black). N = 24 (C), 24 (Flx), 25 (S) and 24 (Flx/S) fish. FTop, acute cold shock induced zig-zag swim patterns during optomotor response, and pre-exposure to fluoxetine did not prevent such stress-induced behavioral changes. Bottom, independent component analysis (ICA) revealed the shift of swim patterns toward turn/escape behavior (IC2) after cold shock. Pretreatment with fluoxetine did not prevent such a shift. See Supplementary Fig. S5B for statistical analyses. G Summary of the behavioral effects of tested antidepressants estimated from changes in spontaneous swimming distances. Stimulatory effects (horizontal axis) were estimated from the change of swimming distance after drug administrations compared to the average of control fish. Anxiolytic effects (vertical axis) were estimated from how much the drug prevented the stress-induced change of spontaneous swimming distance compared to untreated conditions. Error bars represent the standard error of the mean (s.e.m.) across drug-treated fish. See “Methods” for details. H Summary plot of the behavioral effect of tested antidepressants estimated from changes in independent components (IC1, IC2) of body kinematics. Stimulatory effects (horizontal axis) were estimated from the changes along the IC1 axis during spontaneous swimming after drug treatment compared to the average of control fish. Anxiolytic effects (vertical axis) were estimated from how much the drug prevented the stress-induced changes along the IC2 axis compared to untreated conditions during spontaneous swimming. See “Methods” for details.

Psilocybin modulates the activity of the serotonergic system.

A Schematics of neural activity imaging experiments. Fish is immobilized in an imaging chamber and motor signals from the tail were recorded using a pair of electrodes. A light-sheet microscope scans the brain of transgenic zebrafish that expresses genetically encoded calcium indicators pan-neuronally. A visual stimulus (red) is projected beneath the fish. BLeft, behavioral paradigm. Visual gratings stop for 10 s during the spontaneous period (Spont.) and move forward for 10 s to induce optomotor response (OMR) during the OMR period. Right, trial-averaged swim patterns of control (N = 6) and psilocybin-treated fish (N = 7). C The location of the dorsal raphe nucleus (DRN) in the zebrafish brain and its image of expressing nuclear-localized calcium indicator. Scale bar, 20 µm. D Spatial distributions of serotonergic neurons (magenta) and GABAergic neurons (green) in the DRN. Serotonergic neurons occupy the midline area of the DRN, while GABAergic neurons exist in a more lateral area. See a referenced paper [26] for details. Scale bar, 20 µm. E Spatial distribution of neurons that show higher activity during the spontaneous period (left) and the OMR period (right) in a representative fish. Differences in ΔF/F between these two task periods are color-coded for each neuron. FLeft, trial-averaged activity patterns of neurons activated during the spontaneous period (Class 1 neurons, red) and those activated during the OMR period (Class 2 neurons, black) from a representative fish. Right, fractions of significantly active neurons during the spontaneous period (red) and the OMR period (black) in control and psilocybin-treated fish. N = 6 and 7 for control and psilocybin-treated fish, respectively. *p = 0.046 for neurons activated during the spontaneous period by Wilcoxon’s rank-sum test. GTop, low dimensional representation of neural state dynamics in control fish (left) and psilocybin-treated fish (right). We applied non-negative matrix factorization (NMF) to the trial-averaged neural activity of all recorded neurons from all tested fish to calculate NMF components. Averaged trajectories of control and psilocybin-treated fish are plotted with thick lines, and trajectories of individual fish are plotted with thin, transparent lines. Trajectories during the spontaneous period (see B) were plotted in red, and those during the OMR period were plotted in black. Dots represent time points of recording at 1 Hz. Bottom, our hypothesis of psilocybin-induced changes in neural dynamics in the DRN. Psilocybin elevates the excitability of GABAergic neurons, which in turn suppresses the activity of serotonergic neurons.

Acknowledgments
This image is the copyrighted work of the attributed author or publisher, and ZFIN has permission only to display this image to its users. Additional permissions should be obtained from the applicable author or publisher of the image. Full text @ Mol. Psychiatry